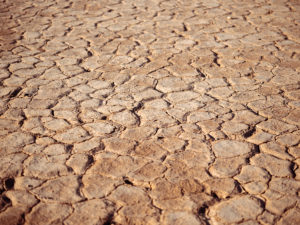
When we began these posts there was a clear forecast for a strong El Niño, one nurturing hope that California’s multi-year drought might be broken by a normal — even wet — rainy season. However, despite media hype about a drought-busting “Godzilla” super-storm El Niño winter, the atmospheric science community wasn’t convinced that would be the case.
Remember, they are an exotic species in the Western United States, and are rapidly increasing their geographic range and range of habitats. Are they outcompeting or excluding native species in the process? How would we know? We have done almost nothing to monitor changes in the assemblage of mushroom species in areas before and and after the incursion of death caps.
Further Reading
Pringle et al, “The ectomycorrhizal fungus Amanita phalloides was introduced and is expanding its range on the west coast of North America,” Molecular Biology 2009
Lockhart et al, “Simultaneous emergence of multidrug-resistant Candida auris on 3 continents confirmed by whole-genome sequencing and epidemiological analyses,” Clinical Infectious Diseases 2017
Battalani et al, “Aflatoxin B1 contamination in maize in Europe increases due to climate change,” Scientific Reports 2016
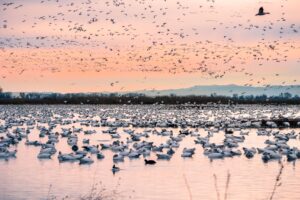
El Niño: Beyond the Hype
Bay Nature goes beyond the headlines to explore what the strongest El Niño in recorded history might mean — or not — for Northern California. We’ll post new articles here throughout the fall.
This series has been funded by donations from Bay Nature readers. Please help us by sharing our work, or donate today to support our mission to explore the natural world of the Bay Area.
All sorts of reasons were given for this hedging: all El Niños are different; rain would fall, but mainly in southern California; there were significant differences between this El Niño and the wet winters of ’83 and ’98; “The Blob” of warm water off the coast would mess things up; the Ridiculously Resilient Ridge (RRR) was still a volatile factor; the sea surface temperatures (SST) were actually too warm and could inhibit the formation of Pacific storms, and on and on. Unspoken in all this hedging was the intellectual hangover from 2014 when a strong El Niño was predicted, then mysteriously disappeared and never happened.
But now the mood and message is more upbeat, with far less hedging and even agreement that, yes, this El Niño winter could be a wet one. Not just in southern California where historically the effects of El Niño are greater, but also in central and northern California.
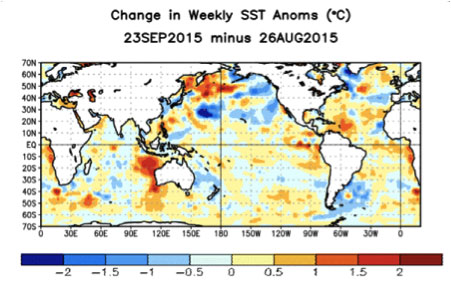
So what’s changed in the last month? First, as predicted The Blob is no longer, having moved westward and lost its anomalous warmth through mixing with colder north Pacific waters.
Second, the RRR has weakened considerably in the last several weeks, opening the storm door in the Pacific Northwest with drenching rains that quenched their disastrous fire season, and possibly — just possibly — allowing some early season North Pacific storms into northern and Central California. More on that later. Third, we’ve already seen the effects of El Niño in the southern part of the state with record-breaking mid-September rains from Tropical Storm Linda. Warmer tropical El Niño waters created more and stronger tropical storms, some of which will continue to affect Southern California this autumn. As well, these warm waters off Mexico’s coast have also enhanced the Southwest’s monsoonal rains that often spill over into Southern California.
Looking at the Seasonal Forecast Models
Much of the optimism for a wet winter is based on the array of computer models that attempt to predict the future. OK, yes, I fully appreciate the accuracy of weather forecasts is notoriously sketchy beyond five days in the future; true, and in a way this places computerized seasonal forecasts into a special realm of their own, some say closer to The Farmer’s Almanac predictions and those based upon furry caterpillars and squirrel nut-gathering activity.
The “official” seasonal forecasts come from our National Weather Service (NWS) and break the probability of future precipitation into three simple categories: above normal; below normal; and equal chance of rainfall being above or below normal. These computer forecasts use the past to predict the future by drawing upon the last 30 years of weather data. Because many professionals (and I’m one of them) are no longer convinced the past is the best guide to future weather given the effects of global warming with its novel (or unseen before) conditions, these NWS seasonal maps are considered ultra-conservative. But let’s take a look anyway.
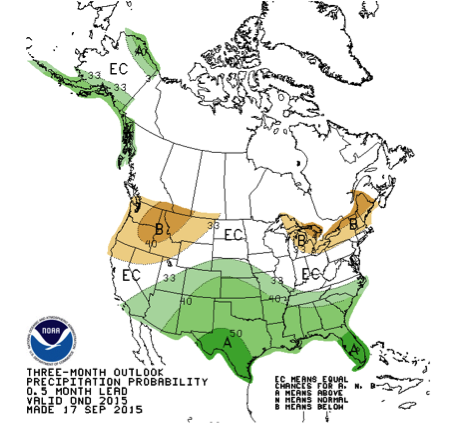
Map 1. October-November-December (OND). This 3-month seasonal map shows a dry autumn in most of California through December, with the only above normal rainfall in Southern California. Note, though, the strong drought (below normal rainfall) in far northern California and the Pacific Northwest. One might call this conventional El Niño wisdom, with a wet Southern California early season and a very dry Pacific Northwest.
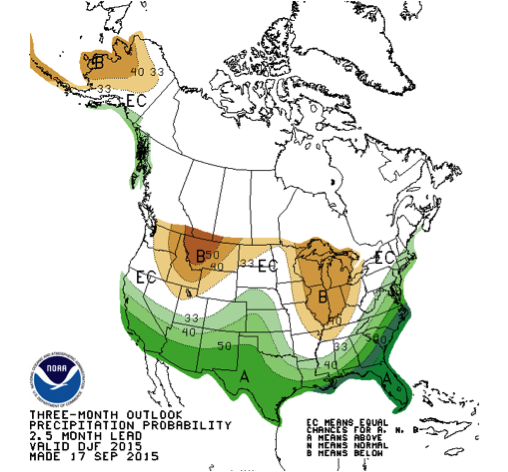
Map 2. December-January-February. The big changes come with the DJF map. Here the above normal line now extends into Northern California. Good news.
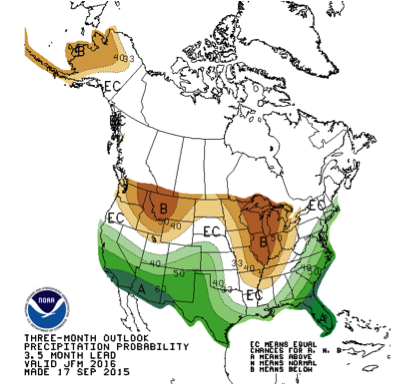
Map 3. January-February-March. The JFM map is even better with 50 percent chance of above normal rainfall north of Monterey Bay. Also the 33 percent probability line now includes much of Northern California. Really good news for Shasta Lake and other northern reservoirs.
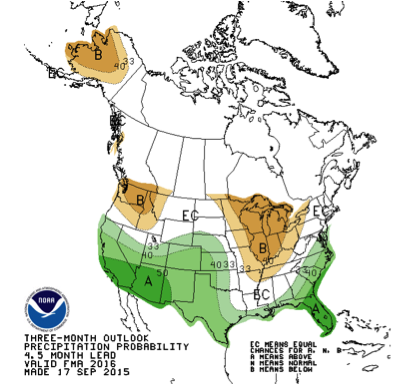
Map 4. February-March-April. In Northern California El Niño effects are generally greater late in the rainy season, and here we see that as the 33 percent probability line moves north to include all of Northern California.
Remember, they are an exotic species in the Western United States, and are rapidly increasing their geographic range and range of habitats. Are they outcompeting or excluding native species in the process? How would we know? We have done almost nothing to monitor changes in the assemblage of mushroom species in areas before and and after the incursion of death caps.
Further Reading
Pringle et al, “The ectomycorrhizal fungus Amanita phalloides was introduced and is expanding its range on the west coast of North America,” Molecular Biology 2009
Lockhart et al, “Simultaneous emergence of multidrug-resistant Candida auris on 3 continents confirmed by whole-genome sequencing and epidemiological analyses,” Clinical Infectious Diseases 2017
Battalani et al, “Aflatoxin B1 contamination in maize in Europe increases due to climate change,” Scientific Reports 2016
Reading List
Each post in Bay Nature’s El Niño series features a reading list with links to more technical or scientific explanations.
- National Weather Service Climate Prediction Center, Three-Month Outlook for Temperature and Precipitation (updated by the 10th of each month)
- NWS, How to Read the Three-Month Outlook Maps
- The North American Multi-Model Ensemble (MME)
- The International Multiple-Model Ensemble (IMME)
- The California Weather Blog, Record-Strength El Nino Likely to Bring Wet Winter to California
- Wikipedia, Numerical Weather Prediction (a background on how to read weather models)
Even More Optimism: Multi-Model Ensembles (MME)
Several years ago NOAA and NWS began experimenting with a whole new suite of supercomputer seasonal forecast models. Instead of drawing upon past weather and climate for their data, these models are much more dynamic since their algorithms are based not on past data but on current and future weather conditions that then builds forecast outcomes on changed (and changing) conditions. Although still in the experimental stage these MME models are demonstrating good forecasting skills and will mostly likely become the source for NWS “official” seasonal forecasts sometime soon.
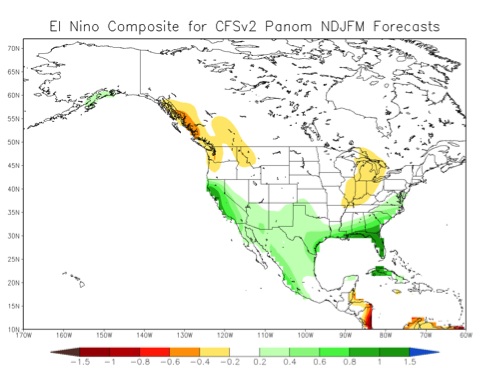
Map 5. The MME El Niño Composite Map NDJFM (November thru March). Note that this map has higher rainfall anomalies (that is, wetter) in Northern California than the NWS maps with their Southern California bias. Really, really good news for the north. (No need to be concerned about the white areas right along the California coast for they’re simply data collection issues, not dry forecasts).
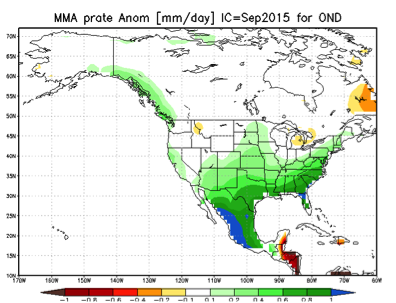
Map 6. IMME for October-November-December (OND). An expanded version of the experimental MME ensemble incorporates forecast models from Europe, Australia, and Asia, hence are referred to as the International Multi-Model Ensemble (IMME). Unlike other maps the autumn maps shows a wet California.
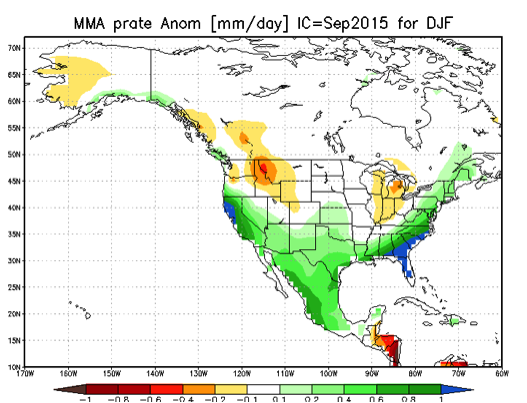
Map 7. And then it gets even wetter. IMME, December-January-February. This is my favorite map of all the model output, showing a wetter northern California than in the south, and with an earlier onset of El Niño precipitation. Let’s thank the international weather community for this model … and hope they’re right.
In Summary
The tide has turned, with much more professional agreement from the climate science community that California will get a wet winter from this season’s El Niño. More to the point, earlier this week on a NOAA webinar a respected professional opined that there’s only a 5 percent chance California will receive less than normal rainfall, and 95 percent that we’ll receive more rain than normal.
We’ll continue to update the forecast every several weeks, so stay tuned … with your fingers crossed.