The average map, I’ve always felt, is more interesting than the average book. It can certainly tell you more about a place, faster. A map shows relationships; it raises questions; it hints at narratives.
Those wavering contour lines on a topographic sheet, once you get the hang of reading them, build a whole land-shape in your mind. Here is an outward-leaning ridge, here an inward-cutting canyon. Here you see how a swelling ocean has invaded a tectonic depression, creating a San Francisco Bay; here, how a creek has maintained its course across a slowly rising ridge, carving a Niles Canyon. A green wash of woodland color on one side of a stream but missing on the other shows the power of sun-exposure, or “aspect.” A solid blue stream line promises water in summer; a dashed one does not.
Beyond topography, and with ever-increasing subtlety, specialized maps can show us what rocks underlie the land and what soils cloak it, what rain and fog and wind and heat beset it, what grows and bounds and creeps and flies upon it, what people have done and are doing to it, and what they may plan to do.
Maps used to be more or less fixed artifacts, often lovingly hand-drawn. But in the computer age, with its eyes in the sky, its geographic information systems, and its general explosion of data, that object you unfold on the trail or peruse on a screen has to be seen in a new way: not as a thing in itself but as one visible wave on the surface of a sea of knowledge, a made-to-order sample featuring the aspects that the user of the moment requires.
That user may be a hiker mainly concerned about taking the correct fork of a trail, a botanist wanting to pinpoint the habitat of an endangered species, or a park district contemplating future possibilities for outdoor recreation and wildlife protection.
A HISTORY IN MAPS
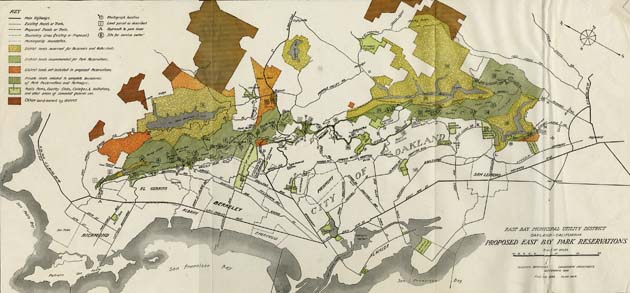
The East Bay Regional Park District might be said to have begun with a map. It was in 1928 that the East Bay Municipal Utility District took over 40,000 acres from a private water company. Much of that acreage, not tributary to reservoirs existing or planned, was in danger of being sold off. A citizens’ group hired Ansel Hall of the National Park Service and landscape architect Frederick Law Olmsted Jr. (son of the designer of New York’s Central Park) to take stock of the territory.
The resulting image, published in December 1930, is the kind of map that is all about boundaries and ownership. Already we see the big arc of public lands, like an E with the middle bar missing, its back along the first rank of the East Bay Hills and its arms extending eastward to Briones and Las Trampas, that still exists today. But closer study shows that the early planners had a more limited vision. Their dream was not of many parks but of one: a continuous “Grand Park” along the crest of the Berkeley-Oakland Hills. East of that first ridgetop, big blocks on this map are labeled “not included in proposed Reservations” or simply “Other land.” Some of this unclaimed acreage, including a large chunk west of San Pablo Dam Road adjoining the future Wildcat Canyon Regional Park, was in fact sold off.
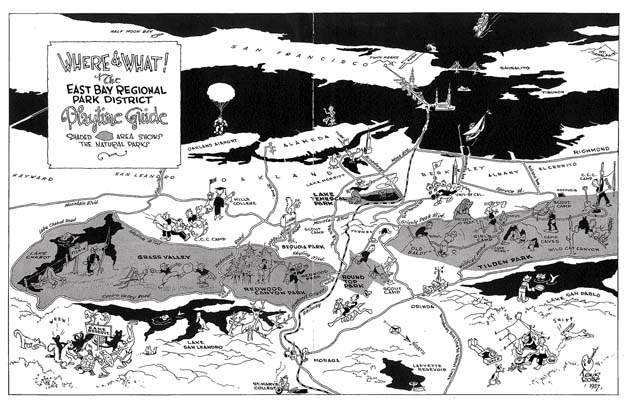
The East Bay Regional Park District was established in 1934. Three years later, having acquired its first couple of thousand acres, the District announced its presence and purpose with a “Playtime Guide.” This depiction, with its amusing cartoon figures walking, golfing, peering into caves, or lolling on the grass, is in the style of another, perhaps more innocent time. (Look at the figure bending to drink out of Lake Chabot.) It is also an example of map-as-campaign-document. You would not know at a glance that most of the land shaded as “natural park,” including the entire left-hand (southern) wing, was still in the hands of EBMUD (and the subject of tough negotiations) when the map was drawn.
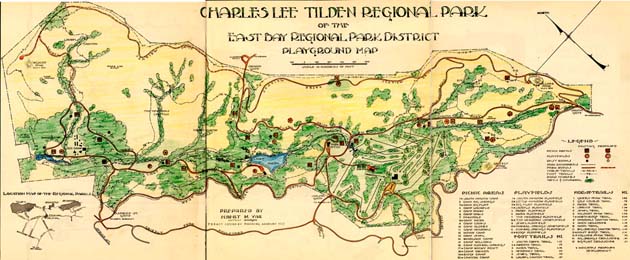
The very handsome Playground Map from the 1940 Tilden Park Master Plan, though credited to General Manager Albert Vail, is probably based on the work of National Park Service planners who came to the District’s aid in its early years. This is a technical map, intended less for the recreational public than for park managers, or for those citizens who like to peer over managers’ shoulders. Showing little of the natural endowment except tree cover, it is essentially a plan for recreational facilities: picnic areas (20), playing fields (12), foot trails (10 miles or so); horse trails (rather more).
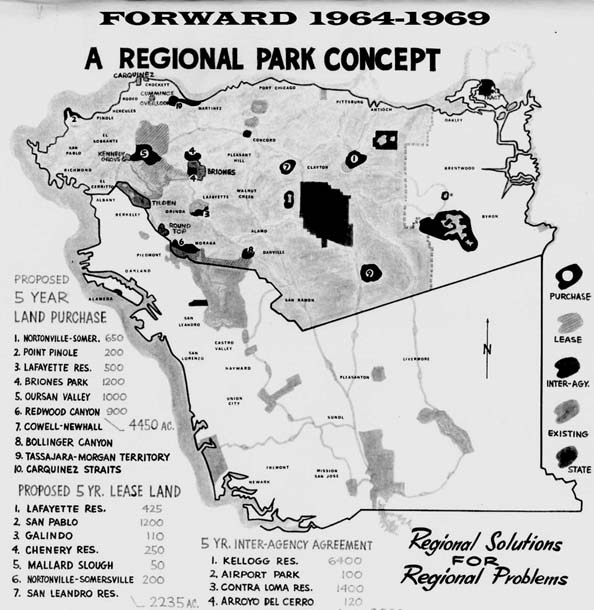
During World War II and the immediate postwar years, the District added acreage slowly and almost exclusively in the Berkeley Hills. Things changed in 1962 with the arrival of an ambitious new general manager, William Penn Mott. Bursting the limits of the “Grand Park” vision, Mott proposed an archipelago of parks across Alameda and Contra Costa counties; his Forward 64–69 Plan shows acquisitions even outside the District boundaries of the day. With a growing park system, it was no longer possible to show all the District’s lands in one brochure, and the familiar single-park maps — now 51 in number — began to appear.
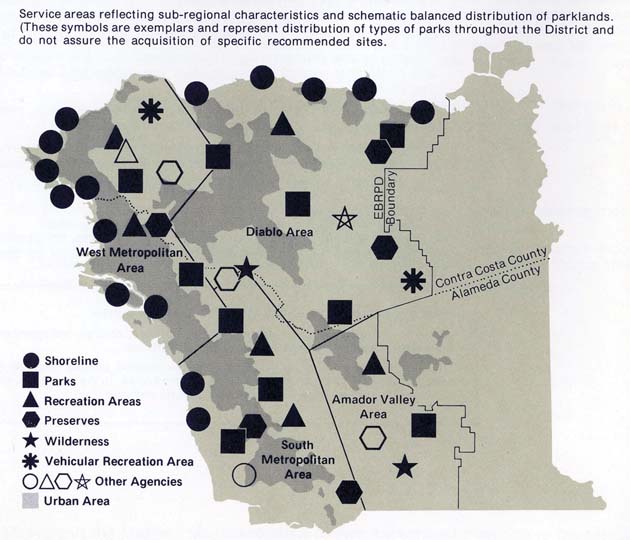
In 1971, the Legislature increased the District’s taxing authority, subject to preparation of a master plan showing how parks would serve all parts of the two East Bay counties. The map that resulted in 1973 is more polished but less communicative than Mott’s. Instead of blobs suggesting definite bound-aries, this one uses cryptic symbols called “exemplars.” Park planners were learning not to get too specific about planned acquisitions, for fear of alarming landowners, driving up land prices, or both. Thus this map illustrates another force at work in the creation of maps: the desire to leave certain information out.
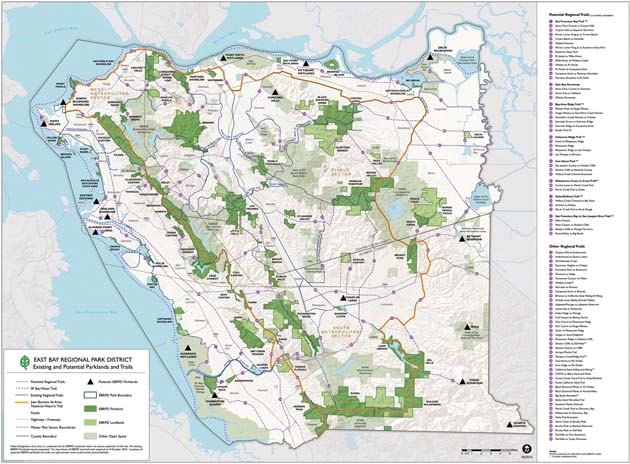
There have been three more master plans for the District since 1973, each showing an increase both in territory and in cartographic sophistication. The latest and most sharply delineated plan map displays new elements: the “land bank” areas, owned by the District but not yet open to the public, and an ambitious network of interpark regional trails, present and proposed. It is suitably coy about hoped-for acquisitions, specifying a few (as black triangles) that will surprise no one. The 2013 map is also the first in the series to reflect a technological revolution.
DIGITAL MAGIC
When Lane Powell, publications coordinator, arrived at the District a quarter-century ago, mapmaking worked like this: You started with USGS topographic sheets, added layers of transparent vellum or Mylar on which were carefully drawn such features as trails, parking areas, and boundaries, and photographed the stack. “Very tedious,” he remarks.
This idea of layering information remains fundamental, but in the early 1990s a superior way of doing it emerged: the geographic information system, or GIS. Credit its early adoption hereabouts to the Oakland Hills Fire of 1991 and the resulting push for better mapping of fuel types and flammabilities. In a GIS, layers of data live in a computer, and they can be endless in number. Typically one consists of aerial photographs and one of USGS topo sheets. There is a layer for plant communities and one for creeks and water bodies. Several layers capture manmade features, and additional ones cover property lines and jurisdictions. In fact, a well-developed GIS contains more kinds of information than the human eye or mind could grasp at one go.
A powerful supplementary tool arrived in 1994, when the global positioning system was opened for nonmilitary use. By reading signals from satellites, a receiver on the ground can establish location, calculate direction, and measure distances and elevations traversed. In the old days, mapmakers might be lucky to locate a raptor nest, for instance, within a quarter-quarter section, one-sixteenth of a square mile; GPS receivers can narrow this to yards. Newly precise information on every aspect of the land came flooding in.
The revolution did not happen overnight. The first GPS receivers were backpack-size and, by later standards, none too accurate. Building a geographic information system required a lot of tedious hours as reams of data got translated into the proper digital forms. “I’m just glad I wasn’t the person sitting in front of the computer entering all this,” says Ecological Services Coordinator Steve Bobzien.
Being digital does not make information flawless. GPS data has to be taken with a grain of salt; the readings from decent hand-held receivers can be off by 15 feet. If you simply superimpose a bunch of uncorrected layers in the database, any map you produce will show oddities like houses in the middle of streams. An editor must intervene. “We do as much as we can to make it accurate,” says District GIS Coordinator David Drueckhammer, “but it’s just as important to make it look right.”
“We use GPS to get accuracy,” says botanist Wilde Legard. “Then we fudge.”
THE HARVEST
It took about 15 years to get the new systems running smoothly. The years of information gathering, adjusting, and debugging had produced a system that could answer more questions faster than ever before.
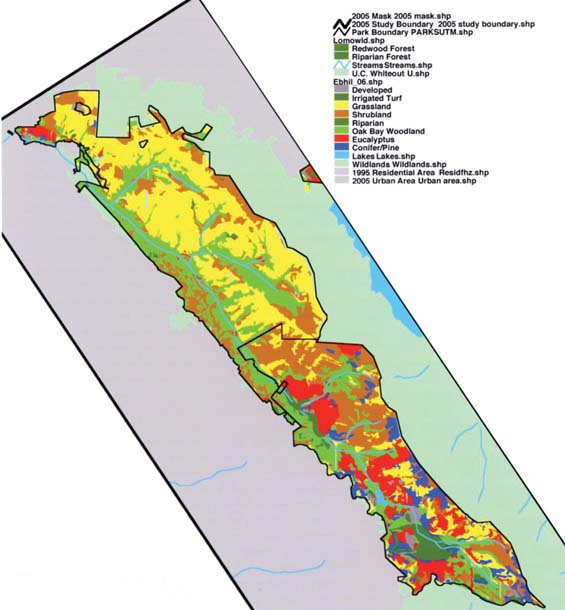
To see how subtlety has grown with these new capabilities, compare the 1940 Tilden Park map with the recent vegetation map of Tilden and adjoining Wildcat Canyon regional parks. Where the old map merely shows trees or the absence of trees, the new one charts the whole mosaic of vegetation: showing, for instance, the broad plantations of fire-prone eucalyptus and pine. Removing such stands wholesale is expensive and sometimes controversial. By combining the vegetation map with other GIS layers that show temperature and wind patterns, the District can narrow its focus to certain stands where the risk of fire — and damage to valued things like buildings and redwood groves — is highest.
Or take the case of the large-flowered fiddleneck, an annual herb with bright orange trumpet-shaped flowers. It grows in native perennial grasslands, a vegetation type on the verge of extinction in the District’s territory. By 1997 the fiddleneck was down to two small populations south of Altamont Pass. Attempted transplants struggled or died out. Botanists hope that GIS will help them determine exactly what factors enable the plant to thrive and where to introduce it next.
Not all park mapping is of lands the District already owns. “In the acquisitions department,” says GIS analyst Beth Stone, “we start at the boundaries and look outward.” For this purpose, parcel maps of the two counties become more important, as does census data. District policy, reflected in its master plans, is to site new parks so that all communities get their share. This allocation “would be pretty tough to do with paper maps,” Drueckhammer says.
MAPS FOR THE PUBLIC
For most people, of course, the guide of choice is not a specialized sheet about fiddlenecks but the broad recreation maps embodied by the District’s single-park brochures. These maps also now flow from the geographic information system, but with a different selection of detail. Many things found in the GIS, like former Ohlone village sites, are naturally omitted. Mapmaker Powell sometimes adds an element not in the database, like a peak symbol for a locally prominent height.
The very precise trail mileages found on these maps have their own story. Between 1990 and 2003 a volunteer named Hal McDonald measured trail mileages with a very old-fashioned tool: the surveyor’s wheel. You push the wheel, equipped with an odometer, in front of you along a path, taking care to keep it on the midline of the trail, in a nicely vertical position, and running smoothly regardless of rocks or mud or other imperfections. It is exhausting work if done for long. McDonald, a chemist at the Lawrence Livermore Lab, did it for long. To get the most accurate possible readings, he walked every trail mile in the District three times. If there was a discrepancy to iron out, he went back again.
Was all this effort, in the GPS era, a waste of time? Not at all, says mapmaker Powell, who worked with McDonald for years. “I’m not convinced that the new technology is as accurate as a wheel.” Typical GPS readings have their own margin of error, and you lose the signal if you go under trees. In fact, the District’s current maps, being quite literally “ground-truthed,” are widely admired for their accuracy. And after nearly 50 years, they are still regularly updated and made available, free to the public, at each park entrance station.
Besides being offered on paper, park brochures in pdf format are now available on the District’s website, ebparks.org. Later in 2014, a sophisticated interactive District-wide map will also be posted. You can enter your location, for instance, and see instantly what parks and even what park entrances are most convenient to you. You can enter an activity, from dog-walking to backcountry camping, and see where you can go.
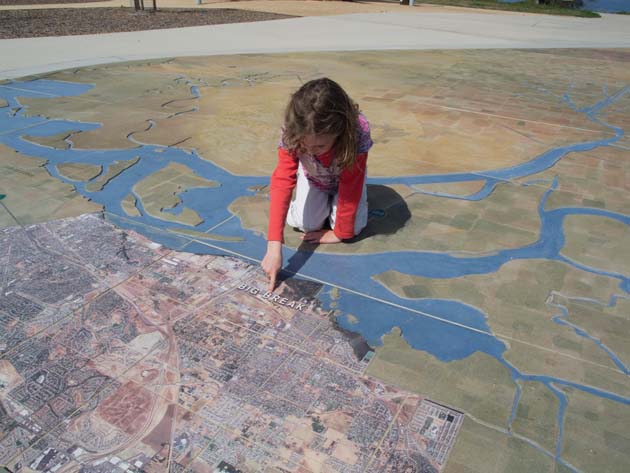
The ultimate in cartography for public education may be a map you don’t unfold or click on, but walk across: the 1,750-square-foot inlaid representation of the Delta at Big Break Regional Shoreline near Oakley. Made by Scientific Arts Studios, it is placed so that map north and world north align. Visitors can trace river channels across it, identify landmarks from it, even tip bottles of water onto it and watch a leisurely westward flow. “It is the anchor of this park,” says Supervising Naturalist Mike Moran. People who are striving to learn, or teach, about California’s toughest water issues come here for orientation. The Delta map is a complement to that other superb miniature, the Bay Model in Sausalito, with the advantage, Moran says, “that this map is in the place.”
MOVING WITH MAPS
For many people on the trail these days, the map of choice is an image on a smartphone, which may or may not be running a dedicated GPS application. None of the widely available types of maps and terrain images — 14 variants are on my phone at the moment — contains as much key information as the EBRPD park maps. District maps themselves can be viewed on portable devices, in two forms: one lacking in topographical detail but crisp at all magnifications, the other more informative but fuzzy when expanded.
Me? I still prefer a paper map, whether original or printed at home from a computer. The telling advantage is the larger “screen size.” I would rather unfold than zoom out or scroll. Then, too, a paper map doesn’t run out of juice or break when dropped.
The most important program, in any case, is one you develop inside your head: “map sense,” the ability to line up map with landscape and keep track of yourself and what you are seeing as you move. What valley are we looking into now? What is the name of that pond? What bigger stream does this small stream flow into? How can we get to the top of that hill? Which loop will give us the least (or most) elevation gain?
With practice, a good map becomes much more than a tool for staying unlost. It’s a doorway into the great and little wonders of a piece of our planet. Land is fascinating. Maps, those shrunken, highly artificial, selectively annotated images of place, are only a little bit less so. To put map and land together is to walk with wider eyes.