A low-hanging, densely clouded sky, intense heat, great humidity and an oily sea — so it began …
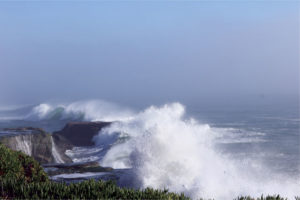
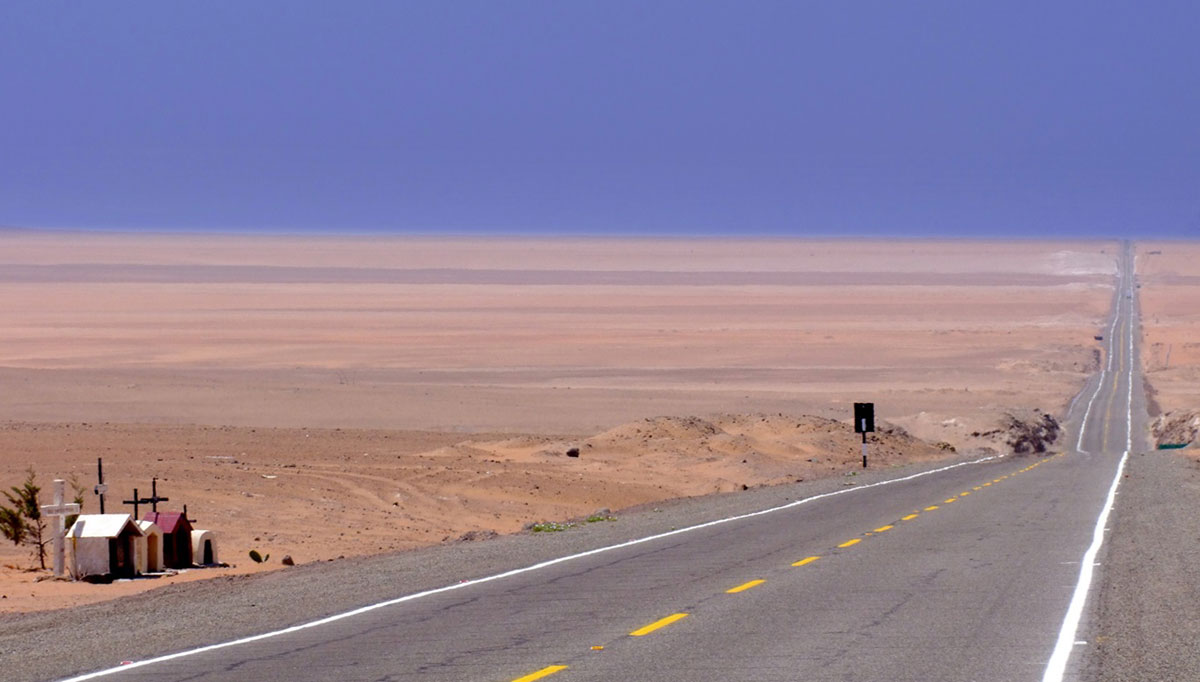
Bare, wind-sculpted dunes march inland from the Pacific coast of Peru. Shielded from the prevailing storm track by the spine of the Andes, some areas of the Sechura Desert get only a centimeter of rain in a typical year. Offshore, cold, nutrient-rich water wells up from the deep ocean, and the north-running Humboldt Current brings a steady flush of cold, nutrient-rich water from Antarctica, feeding one of the most productive fisheries on Earth. But every so often, the current changes direction and the sky breaks open.
In early 1891, a traveler named S.M. Scott was staying near Talara in northwestern Peru when clouds started building on the horizon. Scott vividly recalled the season in a letter he wrote 34 years later: “A low-hanging, densely clouded sky, intense heat, great humidity and an oily sea — so it began … The rain fell in inconceivable torrents for weeks … after dark the sea broke in phosphorescent lightnings along the coast … If the sea was full of wonders, the land was even more so … the desert became a garden.” He described “huge, man-eating sharks” typical of the warm waters off Panama, bananas, coconuts and snakes borne along on the current, swarms of unfamiliar insects in the air and a parade of spiders marching into his house.
Since the 16th century, Spanish colonists in South America had written about these años de abundancia, when torrential rains made the desert bloom. They called it El Niño, after the baby Jesus, since the strange currents tended to arrive around Christmas. Years of abundance onshore brought devastation to the oceans: the anchovy fishery, a staple of the Peruvian economy, collapsed, as fish died or fled in search of colder waters. Fish-eating seabirds starved in droves.
Remember, they are an exotic species in the Western United States, and are rapidly increasing their geographic range and range of habitats. Are they outcompeting or excluding native species in the process? How would we know? We have done almost nothing to monitor changes in the assemblage of mushroom species in areas before and and after the incursion of death caps.
Further Reading
Pringle et al, “The ectomycorrhizal fungus Amanita phalloides was introduced and is expanding its range on the west coast of North America,” Molecular Biology 2009
Lockhart et al, “Simultaneous emergence of multidrug-resistant Candida auris on 3 continents confirmed by whole-genome sequencing and epidemiological analyses,” Clinical Infectious Diseases 2017
Battalani et al, “Aflatoxin B1 contamination in maize in Europe increases due to climate change,” Scientific Reports 2016
El Niño: Beyond the Hype

Bay Nature goes beyond the headlines to explore what the strongest El Niño in recorded history might mean — or not — for Northern California.
This series has been funded by donations from Bay Nature readers. Please help us by sharing our work, or donate today to support our mission to explore the natural world of the Bay Area.
By the late 19th century, when S.M. Scott wrote his letter, Peruvian scientists knew something of El Niño’s effects, but could only guess at its extent or cause. “That this hot current has caused the great rainfalls in the rainless regions of Peru appears a fact,” wrote Federico Alfonso Pezet in 1895, in an address to the Sixth International Geographical Conference in Lima. “What it is necessary to find out, and what would be a most interesting and useful study, inasmuch as it affects the climatic conditions of Northern Peru is (1) the extension, the volume, and the temperature of this counter-current; (2) where does it end?”
The event we still know today as El Niño turned out not to really have a geographic end. It touches almost every part of the globe, affecting the weather in often dramatic ways in India and Peru, North America and the South Pacific. Nobody in 1895 knew that years of abundance in Peru tended to coincide with terrible droughts on the far side of the globe. But like any mystery, the explanation for El Niño has been revealed only slowly, piece by piece over a century, as dedicated researchers in far-flung locations searched for explanations for what they witnessed.

In 1903, Gilbert Walker left a job as a mathematician at Cambridge University, where his interests and expertise ranged from electrodynamics to bird flight to boomerangs, to travel to India to study the monsoon. Modest, liberal, with a keen eye for detail but a knack for big-picture problem-solving, Walker was “the epitome of the English gentleman,” according to archaeologist and historian Brian Fagan, the author of Floods, Famines and Emperors: El Niño and the Fate of Civilizations.
In good years, monsoon rains deliver the water the sustains crops, livestock, and people throughout much of Asia. But a few times in a generation, the monsoons fail and the countryside wither; failures in 1896 and 1899 led to famines that claimed millions of lives. Walker, made director general of the Indian Meteorological Department in 1904, set out to predict when those failures might occur.
Meteorologists at the time were still mostly observing local weather conditions and hazarding short-term limited forecasts. To grapple with a phenomenon the size of the monsoon, Walker needed to zoom way out, beyond the bounds of the science as it stood, to seek data and patterns on a much larger scale, across time as well as distance. A century before “citizen science” became fashionable, Walker mobilized legions of observers via telegraph at stations scattered across the British Empire, and crunched mountains of data cataloging atmospheric pressure, rainfall and temperature.
The former mathematician was among the first to seek statistical correlations between distant weather conditions – like sea surface temperature in the Eastern Pacific or pressure over northern Australia – and drought in India. In 1908 or 1909, he wrote the first regression equation used to forecast weather. And in two decades of gathering observations and devising statistical methods to make objective sense of them, he pieced together a picture of multi-year swings in pressure centers between the western and middle Pacific, which he linked to monsoon failures in Asia. When low atmospheric pressure reigned over northern Australia, Walker found, rain fell 4,000 miles away. When the low pressure center swung thousands of miles to the east, settling somewhere in the neighborhood of Tahiti, monsoons were weak or failed altogether.
In a series of papers, “Correlation in seasonal variations of weather,” published in the Memoirs of the Indian Meteorological Department in 1923 and 1924, he named this see-saw ocean pressure effect the Southern Oscillation. “By the southern oscillation,” he wrote, “is implied the tendency of pressure at stations in the Pacific (San Francisco, Tokio, Honolulu, Samoa and S. America), and of rainfall in India and Java (presumably also in Australia and Abyssinia) to increase, while pressure in the region of the Indian Ocean (Cairo, N.W. India, Port Darwin, Mauritius, S.E. Australia, and the Cape) decreases.”
“The science and tools he used were really pretty basic,” Fagan told me. “Walker was predominantly a statistician. This whole business of the Southern Oscillation — he figured it out without satellites or computer models. He was damn good.”
El Niño these days is more commonly referred to by scientists as ENSO, the El Niño-Southern Oscillation. Walker had figured out the “SO” half. But it would take another generation of scientists to find the other half, to link Walker’s discovery to warm water and años de abunduncia.
“The science and tools he used were really pretty basic. Walker was predominantly a statistician. This whole business of the Southern Oscillation — he figured it out without satellites or computer models. He was damn good.”
Gilbert Walker died in 1958, at the tail end of an El Niño that brought floods and warm oceans to Peru. That El Niño year also coincided with the International Geophysical Year, a blitz of earth scientists from 67 countries working together to survey everything from cosmic rays to seismology to rocket science. One of these scientists was Jacob Bjerknes, a Norwegian-American meteorologist at UCLA. Earlier in his career, Bjerknes had investigated large-scale atmospheric circulation over the North Atlantic, but his work with the IGY drew him to the Pacific for the El Niño of 1957-1958.
In 1957, El Niños in Peru were still thought to be a local quirk, an as-yet-unexplained reversal of the isolated Humboldt Current that spawned weird weather over an isolated region of South America. Bjerknes and his IGY cohort, with more sophisticated sampling techniques than Walker had in his prime, were therefore surprised to find that the telltale slug of warm water wasn’t limited to the Peruvian coast. In fact, it extended thousands of miles into the middle of the Pacific. It was Bjerknes’s first hard clue that El Niños in Peru might be just one expression of a trans-Pacific phenomenon, and that the Southern Oscillation of atmospheric pressure might be associated with similar geographical shifts in sea surface temperature.
Bjerknes hung around the El Niño question through two more strong events, in 1963 and 1965, doing much the same kind of statistical work that Walker had done four decades earlier — except with information from satellite readings showing previously unrecorded temperatures and rainfall in the middle of the Pacific. Bjerknes baked up the first hypothesis – published in “Atmospheric teleconnections from the Equatorial Pacific” in the Monthly Weather Review in 1969 – that linked El Niño conditions in the waters off Peru to the Southern Oscillation in the atmosphere over the distant tropical Pacific. “With brilliant elegance, supported by convincing dynamic and thermodynamic reasoning, Bjerknes pulled together a number of critical elements into a new conceptual framework,” Fagan writes in Floods, Famines and Emperors.
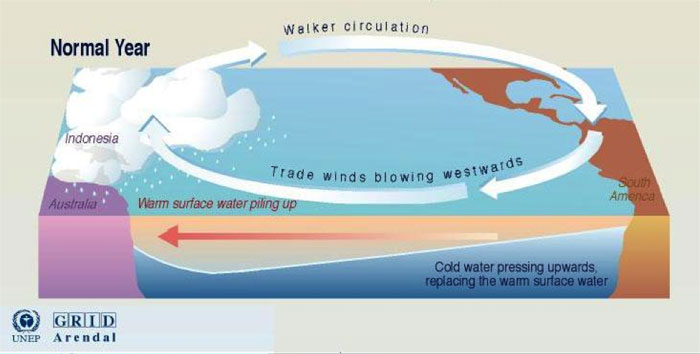
Bjerknes named the mammoth circulation of trade winds, tropical rains, and ocean water that he’d identified the “Walker Circulation.” His model goes something like this: In normal years, the earth’s rotation causes trade winds to blow steadily from east to west across the equatorial Pacific. Warm surface water pushed by the trades pools up against Australia, while cold, nutrient-rich water from the deep ocean wells up off of South America to take its place. The warm pool in the western Pacific warms the air above it, which begets low atmospheric pressure overhead. Warm, moist air rises, cools and condenses, fueling regular rains over Southeast Asia (the monsoon). Wrung out over the western Pacific, cooler, drier air then flows back east in the upper reaches of the troposphere before settling down along the west coast of South America, causing high pressure and typically clear, stable weather over the deserts of Peru and Chile. The gradient between high pressure in the east and low pressure in the west then vacuums the air back west along the equator (trade winds, again) closing a gargantuan circulatory loop:
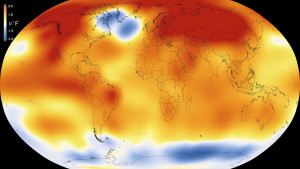
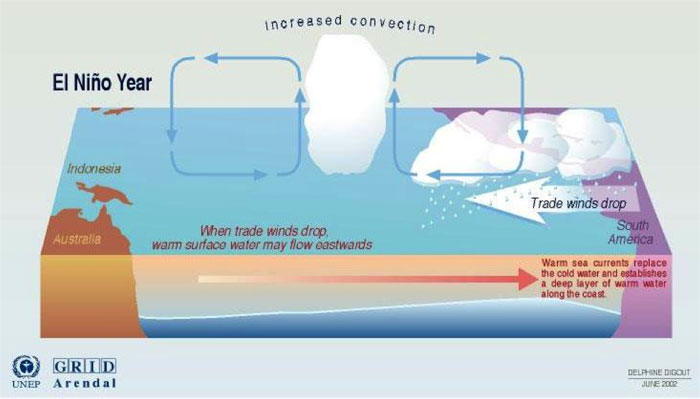
But in El Niño years, trade winds slacken, and the hot pool in the western Pacific sloshes back to the east. Rain that might have fallen in India instead falls back into the open ocean. Because it is so enormous, the vagaries of the Southern Oscillation can shift the jet stream, impacting weather in places far removed from the tropical Pacific: colder winters in northern Europe, floods on the White Nile, and often – but not always – rain in Northern California.
Bjerknes’s hypothesis started working its way into the literature in the 1970s, but its implications for global weather were still fairly obscure when a very strong El Niño sent the world’s weather around the bend in 1982-1983, bringing rains to the Peruvian desert and heavy snows and flooding in California, and spinning out at least a dozen tropical cyclones in the Pacific. As late as December 1982, scientists with the American Geophysical Union were telling The New York Times that the warm water along the coast of Peru was attributable to sulfur spewed into the atmosphere by a Mexican volcano the previous spring. “We didn’t hear about that El Niño until after the fact,” says Bay Area meteorologist Jan Null, who was a lead forecaster for the National Weather Service at the time and has taught meteorology at San Francisco State and San Jose State. “Then there was a big push to set up buoys in the Pacific to monitor ocean temperature below the surface, so we could see the next one coming. These things tend to take a disaster to get off the ground.”
The Tropical Atmospheric Ocean (TAO)/TRITON project that was instigated following the 1982 El Niño is a network of 70 buoys moored in the tropical Pacific. NOAA monitors the eastern portion of the array, and Japan manages the buoys in the western Pacific. Since 1994, the TAO/TRITON array has supplied continuous real-time data via satellite from some of the most remote places on Earth, and has been a key component in our growing ability to predict El Niños.
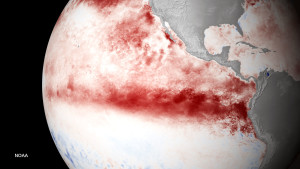
Early in 1997 the new buoy network started to register phenomenally warm water out in the middle of the Pacific. This time, scientists had an idea what to make of it. “Things were really cranking up by early summer,” Null recalls. “I went around briefing emergency services and county officials, telling them, ‘You better be prepared for a wet winter.’”
California got almost twice its normal rainfall that year. Nearly a century after Walker headed to India to study the monsoon, scientists had presaged a strong El Niño months before its effects were felt.
Yet while El Niños follows the broad pattern of development and dissolution of their predecessors, each has its own personality that makes it a tough nut to crack.
Remember, they are an exotic species in the Western United States, and are rapidly increasing their geographic range and range of habitats. Are they outcompeting or excluding native species in the process? How would we know? We have done almost nothing to monitor changes in the assemblage of mushroom species in areas before and and after the incursion of death caps.
Further Reading
Pringle et al, “The ectomycorrhizal fungus Amanita phalloides was introduced and is expanding its range on the west coast of North America,” Molecular Biology 2009
Lockhart et al, “Simultaneous emergence of multidrug-resistant Candida auris on 3 continents confirmed by whole-genome sequencing and epidemiological analyses,” Clinical Infectious Diseases 2017
Battalani et al, “Aflatoxin B1 contamination in maize in Europe increases due to climate change,” Scientific Reports 2016
Reading List
Each post in Bay Nature’s El Niño series features a reading list with links to more technical or scientific explanations.
- Biography of Sir Gilbert Walker, Walker Institute
- Tellus, “A possible response of the atmospheric Hadley circulation to equatorial anomalies of ocean temperature,” by Jacob Bjerknes, 1966
- Golden Gate Weather Services El Niño / La Niña Resource Page
- “El Niño and California Precipitation,” NOAA Western Region Technical Attachment, by Jan Null and John Monteverdi, 1997
- Climate.gov El Nino blog, “Why Past ENSO Cases Aren’t the Key to Predicting the Current Case,” by Anthony G. Barnston
“Analog forecasting,” or issuing forecasts based on how previous, similar El Niños behaved, “makes intuitive sense,” writes Anthony Barnston on NOAA’s El Niño blog. Meteorology, after all, has its roots in watching what’s happening while it’s happening, and then applying what we saw that time to predict what will happen next time. But unlike a single thunderstorm or even a summer’s transition into fall, El Niño describes the chaotic interactions of two great fluid masses — atmosphere and ocean — over a broad scale of time and space. If you try to forecast what will happen in any particular El Niño based on previous ones, Barnston says, you’re likely to be disappointed.
The first challenge is defining what constitutes an analog. Who decides when the El Niño started, or what counts as a close match? Analog selection is subjective and inevitably leaves out variables that we don’t even know about yet.
“The severe shortness of the past record prevents an analog approach from bearing much fruit”
An even bigger problem, however, is short data sets. We’ve been keeping a sufficiently close eye on the oceans for only about 60 years, during which strong El Niños have been few and far between. “The severe shortness of the past record prevents an analog approach from bearing much fruit,” Barnston writes. “More complex statistical and coupled ocean-atmosphere dynamical models can make better predictions than analogs.”
Null, who has done foundational work on the relationship between El Niño and rainfall in California, mentions some pitfalls in our current methods of El Niño monitoring and prediction. El Niños are classified by the Oceanic Niño Index, or ONI, which is a measure of how much ocean temperatures in the tropical Pacific deviate from the norm. “The ONI only considers a very specific part of the ocean — between 5 degrees north and 5 degrees south, and 120 degrees west and 170 degrees west,” says Null. (Basically, a box narrowly focused along the Equator, stretching from Kiribati to an area of tropical ocean due south of California.) It’s a representative sample of where we’ve seen warming oceans during prior El Niños, but it leaves big swaths of the Pacific Ocean where gathering warm water can hide out, evading detection. In the last decade, for example, meteorologists have identified a new El Niño Modoki phenomenon, which means “similar but different” in Japanese. El Niño Modoki brings warmer water to the central Pacific, while the eastern and western flanks remain cool.
Computer models, buoys and satellites are an upgrade from Gilbert Walker’s telegraph brigade — but timing, location and competing climate patterns make it tough to say how and when and where and how the effects of this — or any year’s — El Niño will arrive. More broadly, scientists still don’t know what causes the hitch in the Walker Circulation that leads to an El Niño, or what to expect of its periodic behavior in a swiftly warming climate.
“We’re certainly getting better at sampling data,” Null says. “But there’s still a lot more to learn.”