The National Weather Service’s Climate Prediction Center creates all kinds of forecasts for the United States. Familiar and unfamiliar variables, short-term and long-term timescales, pretty much anything you might wonder about and lots of things you probably don’t, the CPC has an outlook for it: drought, rain, monsoon, El Niño and La Niña, Madden-Julian Oscillation, storm tracks, and of course, temperature.
The temperature outlooks for the United States are based on estimating the probabilities of three-month mean temperatures being above or below a 30-year average. The output is a series of groovy, swirly maps that look like this one, for December-January-February 2016:
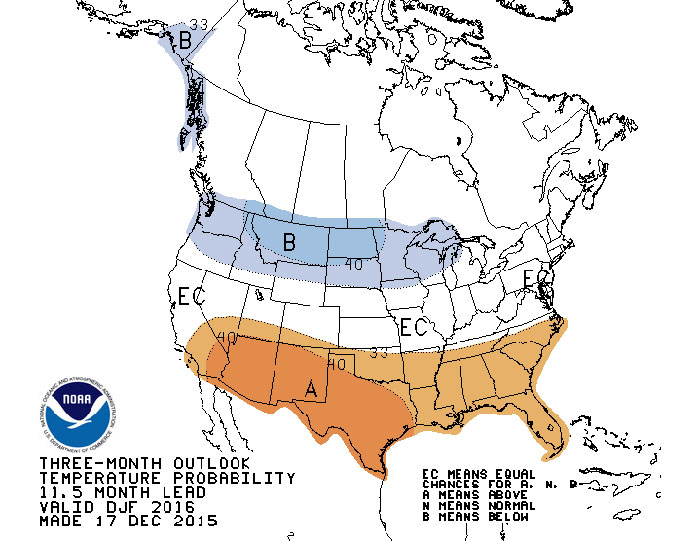
You can look through the various maps and watch the colors swirl around the United States as the forecast changes. But for Northern California the maps don’t change in one critical way. The forecast created on Jan. 21 calls for a greater probability that temperatures are above the 30-year-average in February-March-April of 2016. And March-April-May 2016. And April-May-June 2016. And May-June-July 2016. And June-July-August 2016. And July-August-September 2016. And August-September-October 2016. And September-October-November 2016. And October-November-December 2016. And November-December-January 2016-2017. Our outlook for 2016 is orange.
Remember, they are an exotic species in the Western United States, and are rapidly increasing their geographic range and range of habitats. Are they outcompeting or excluding native species in the process? How would we know? We have done almost nothing to monitor changes in the assemblage of mushroom species in areas before and and after the incursion of death caps.
Further Reading
Pringle et al, “The ectomycorrhizal fungus Amanita phalloides was introduced and is expanding its range on the west coast of North America,” Molecular Biology 2009
Lockhart et al, “Simultaneous emergence of multidrug-resistant Candida auris on 3 continents confirmed by whole-genome sequencing and epidemiological analyses,” Clinical Infectious Diseases 2017
Battalani et al, “Aflatoxin B1 contamination in maize in Europe increases due to climate change,” Scientific Reports 2016
El Niño: Beyond the Hype
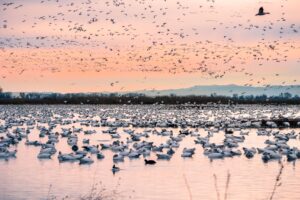
Bay Nature goes beyond the headlines to explore what the strongest El Niño in recorded history might mean — or not — for Northern California. We’ll post new articles here throughout the fall and winter.
This series has been funded by donations from Bay Nature readers. Please help us by sharing our work, or donate today to support our mission to explore the natural world of the Bay Area.
Finally, in December-January-February 2016/2017, the forecast gives us a break — Northern California climbs down to an “equal chance” for above, below, or normal temperatures. That’s likely just because at this point, 12 months away, there’s no information to make any kind of valid prediction. Why the estimated long hot year? At least to start, blame El Niño. “All temperature tools continue to strongly favor above-normal temperatures across the northern half of the Continental U.S. through the early spring, which is consistent with a strong El Niño,” forecaster Matthew Rosencrans writes in the technical discussion that accompanies each new outlook. “Also, above-normal SSTs along the West Coast contribute to the enhanced odds for above-normal temperatures.”
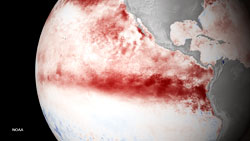
A record strength El Niño means a record-warm tropical Pacific, and even as the event itself slowly fades, that heat charges into the atmosphere, keeping it warm through spring and probably even into summer. A La Niña, which can lead to drier and warmer conditions across the southern United States if it happens, might then keep Southern California warm through the winter.
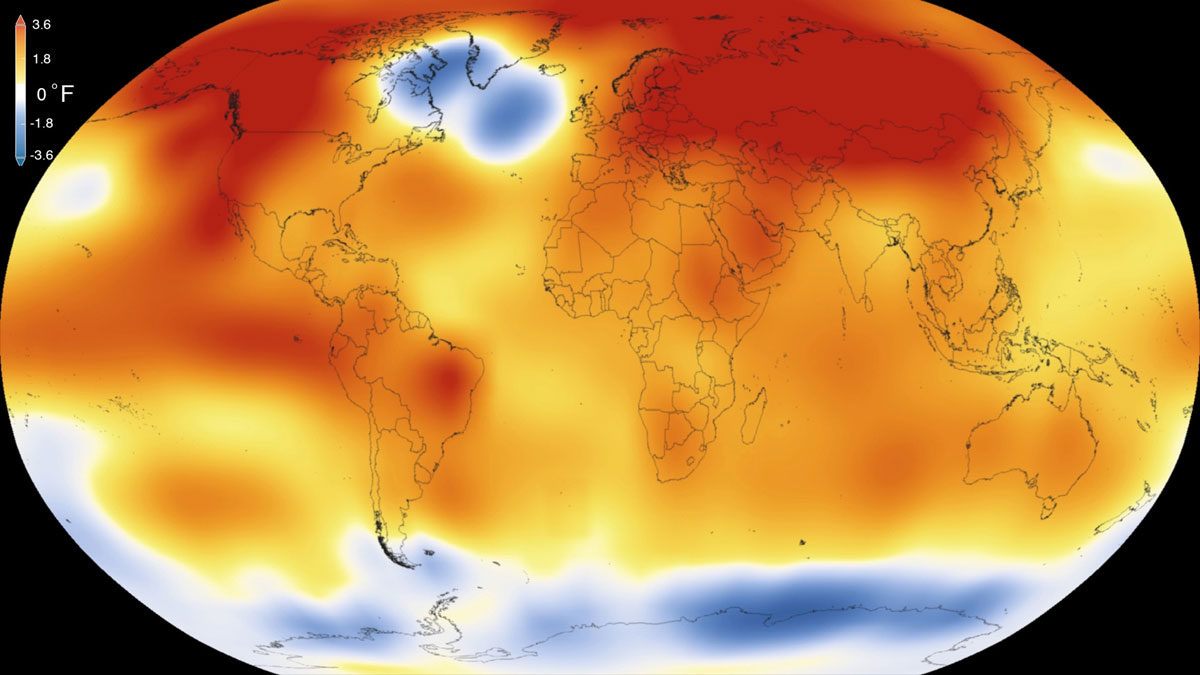
But we’ve already had several consecutive hot years. Scientists announced on Jan. 20 that globally 2015 was the new hottest year ever recorded, beating out 2014. Those are also California’s two hottest years on record, although 2014 was warmer than 2015 here. And you can’t fully blame El Niño for those. There was a weak El Niño in 2014-2015 and a stronger one at the end of 2015, but climate scientists have generally agreed that even without it, those years would have been warm. The change, they say, has largely been driven by greenhouse gases. “2015 was remarkable even in the context of the ongoing El Niño,” Goddard Institute for Space Studies Director Gavin Schmidt said in a press release posted by NASA. “Last year’s temperatures had an assist from El Niño, but it is the cumulative effect of the long-term trend that has resulted in the record warming that we are seeing.”
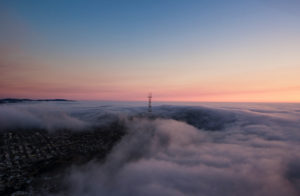
At some point, as you swat mosquitoes in a humid fog in San Francisco in January, you begin to wonder if we’ll ever again see a cooler-than-average year. “It’s a very fair question,” said Jon Gottschalck, the head of forecast operations at the CPC.
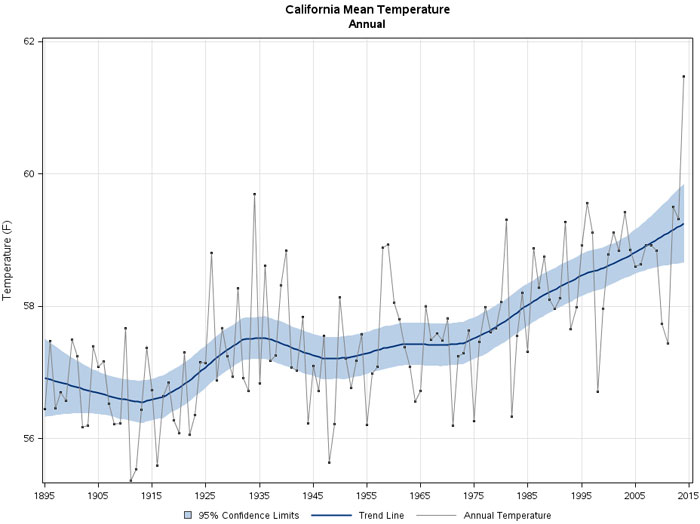
The likelihood of that cold year, if we continue to use the 20th century average as a baseline, is increasingly remote. “The good money now in any year is that it’s warmer than it was on average in the 20th century,” said Stanford graduate student Daniel Swain, who writes about California weather and climate at the California weather blog. “The world we live in now is one in which the average is no longer the average. The climate has changed in a way that is now detectable, and in some cases perceptible on the ground.”
Combine global warming and a major El Niño and you get what we see now. In climate records going back to the 1800s, there are occasionally two-year periods of record-breaking heat. There has never been a three-year period. “If 2016 turns out to be as warm as we anticipate,” Schmidt told the Los Angeles Times, “that would be unprecedented in our record book.”
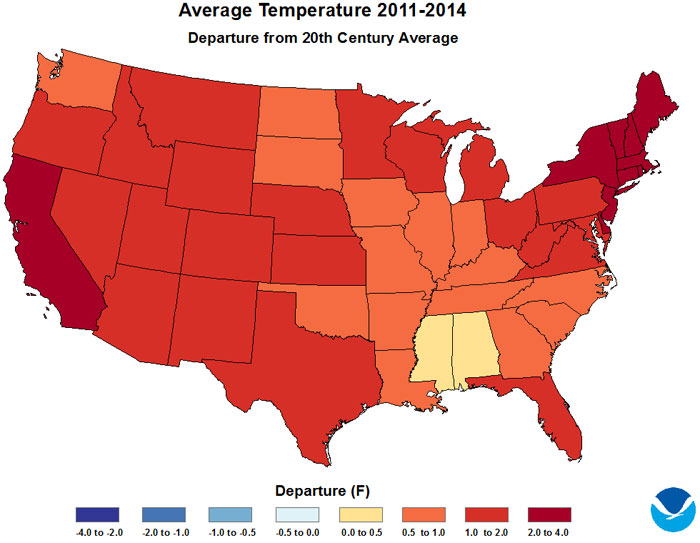
The heat in California in 2014 and 2015, Gottschalck said, was driven less by El Niño and more by that familiar villain, the ridge of persistent high pressure over the Northeastern Pacific. Although the ridge and the pool of hot water it helped spawn (which came to be known as “the Blob”) are both gone (or fading) because of the El Niño pattern, what’s to prevent them returning? Alas: nothing. Some researchers, in fact, say that global warming has increased the probability of such persistent ridges in the future. Utah State University climate scientist Simon Wang has suggested that strong ridges will increasingly form as a “precursor” to El Niños.
In a paper last March in the Proceedings of the National Academy of Sciences, Swain, graduate student Danielle Touma, and Stanford Associate Professor of earth system science Noah Diffenbaugh looked at two factors in California’s historic drought history: temperature and rain. The worst droughts, of course, happen when it’s dry and warm, but in the past century, those two haven’t necessarily always happened together.
They do now. Dry and warm years, the researchers found, occurred more than twice as often between 1995-2014 as they had occurred between 1896-2014. They note that while 58 percent of “moderately dry” years between 1896-2014 were also warm, every moderately dry year in the last two decades has been warm.
“What’s happening to the temperature on the planet is obvious. It’s getting warm.”
Remember, they are an exotic species in the Western United States, and are rapidly increasing their geographic range and range of habitats. Are they outcompeting or excluding native species in the process? How would we know? We have done almost nothing to monitor changes in the assemblage of mushroom species in areas before and and after the incursion of death caps.
Further Reading
Pringle et al, “The ectomycorrhizal fungus Amanita phalloides was introduced and is expanding its range on the west coast of North America,” Molecular Biology 2009
Lockhart et al, “Simultaneous emergence of multidrug-resistant Candida auris on 3 continents confirmed by whole-genome sequencing and epidemiological analyses,” Clinical Infectious Diseases 2017
Battalani et al, “Aflatoxin B1 contamination in maize in Europe increases due to climate change,” Scientific Reports 2016
Reading List
Each post in Bay Nature’s El Niño series features a reading list with links to more technical or scientific explanations.
- National Weather Service Climate Prediction Center
- NASA, NASA and NOAA Analyses Reveal Record-Shattering Global Warm Temperatures in 2015
- Los Angeles Times, 2015 Was The Hottest Year on Record, and the Forecast for 2016 Is Warmer Yet, by Deborah Netburn
- The California Weather Blog, Enhanced El Niño Storm Track Has Finally Emerged
The short-term good news is that this year’s El Niño killed the ocean conditions that caused the ridge. Although California still faces a massive rainfall deficit, a more normal winter and the projection of more rain to come has also temporarily relaxed concern about drought. There’s enormous uncertainty in those swirling CPC maps; there’s a reason they call them “outlooks” and not “forecasts.” Tim Barnett, an emeritus marine geophysicist at the Scripps Institution of Oceanography at UC San Diego, says his model shows a cool event in the second half of 2016 that will lead to this being a cooler-than-average year on the West Coast. That statistical model accurately forecast the La Niña cooling following the 1997-1998 El Niño, Barnett said, and to him, at least, this event looks a lot like that one. “It’s a carbon-copy of what happened there,” he said, “and the model verified there.”
Still … paint the long-term outlook red. Move beyond what happened in a single year, or even one or two years, Barnett says; there’s too much noise in such a short time period. Obsessing over spikes in the chart and year-to-year records, he suggested, makes us lose sight of the more linear, multi-decade trend. “What’s happening to the temperature on the planet is obvious,” Barnett said. “It’s getting warm.”
Diffenbaugh, Swain and Touma’s 2015 PNAS paper suggests that California is well on its way to every year being warmer than the long-term average. There’s uncertainty about what climate change means for California precipitation, with much of the evidence suggesting it will become slightly wetter. But whenever we do have a dry year — and there’s also evidence that dry years will be extremely dry — its effects will be worse. “The emergence of a condition in which there is a ~100% probability of an extremely warm year substantially increases the risk of prolonged drought conditions in the region,” the paper concludes.
We haven’t known about the implications of a strong El Niño for that long. Once scientists figured it out, though, we had this magnificent predictive tool: the ENSO cycle was such a major climate driver that when its signal appeared, the world forecast for the year could more or less snap into place. This winter we are seeing a strong El Niño and on a global scale, a characteristic response. It doesn’t feel that way in Los Angeles, though, where it’s been a pattern-defying, frustratingly dry year (so far). Beginning last summer, when the current El Niño’s intention became clear, most predictions called for high probabilities of above-average rain in Southern California this winter. The rain hasn’t arrived yet because subtleregional shifts in atmospheric and oceanic conditions have thrown off the pattern. In global warming, El Niño may now have a challenger as a major climate driver.
El Niño still provides predictive clarity at the macro level. But we don’t feel macro changes. We’re regional-level creatures. And the non-textbook nature of this year’s event has in a way shown how climate change might scratch the lenses on our meteorological binoculars. “We use these ENSOs as a useful heuristic,” Swain said. “The reason it’s been such a good predictor is historically there have been these stable sea surface temperature configurations associated with El Niño or La Niña. As the ocean warms, it’s not warming in a uniform way. So that might not produce the same effects in the future as it has in the past.”
The baseline, in other words, has shifted. And so as this El Niño begins to weaken — and as we have seemed to say every few months over the last three years of California drought, heat, and record extremes –here we are again, fingers crossed, peering off the edge of the orange map.