In a famous experiment in the early 1960s, the mathematician and meteorologist Edward Lorenz was running computer simulations of weather patterns, trying to see how they changed when he changed variables like wind or temperature at the start. One day, Lorenz decided to round up one of the input variables, from 0.516127 to 0.516, and then walked away from his computer. When he came back several hours later, to his surprise, the results were totally different. This prompted him to ask “whether, for example, two particular weather situations differing by as little as the immediate influence of a single butterfly will generally after sufficient time evolve into two situations differing by as much as the presence of a tornado.”
The experiment and the “butterfly effect” as it came to be since immortalized in popular culture, helped lead to a new understanding of nature in which it went from being mechanical and knowable to unpredictable and chaotic. It also showed one of the reasons weather is so hard to forecast beyond a few days.
Which is a way of saying: a lot of people ask what it takes to make it rain in California, and the answer relies on a bewildering variety of inputs, some of them very complex and very far away. One of the most intriguing, and least understood, is a weather phenomenon called the Madden-Julian Oscillation, or MJO.
The MJO is a large tropical system of clouds, rainfall and wind patterns—imagine a traveling storminess—that takes 30 to 60 days on average to work its way across the globe. The system typically begins forming over the equatorial Indian Ocean and travels eastward, flanked on both sides by dry regions. The stormy region, which has more clouds and rainfall, is referred to as the enhanced part of the MJO, while the dry patches on its east and west with less rain are called the suppressed part. (While the storminess pattern generally stops over the Central Pacific, the wind pattern races all the way across the Atlantic and back to the Indian Ocean.)
Despite its tropical origin, the MJO matters to Californians because as it gains momentum, it sets off a wave of weather phenomenon much beyond the tropics. Just like the fabled butterfly flapping its wings, it causes changes that can lead to extreme heat waves, cold air outbreaks and flooding rains. The better we understand those connections, scientists say, the better handle we’ll have on the weather in California. “Because the atmosphere is all connected—you have the oscillation in the tropics, it has a ripple effect, and the energy is transported poleward and then to the West Coast,” says Yang Zhou, a postdoctoral researcher at the Lawrence Berkeley National Laboratory who studies atmospheric rivers. “It seems far away from California, but it does have an impact.”
“It seems far away from California, but it does have an impact.”
Scientists use the geographical location of the storms of the MJO to divide it into eight phases as it wanders the oceans. In phase 1, the dry and clear part is over the Indo-Pacific Maritime continent (the many islands of Indonesia, Malaysia, Singapore, the Philippines and Papua New Guinea), while the enhanced phase develops over the Indian Ocean. In phases 2 and 3, these wet signals over the Indian Ocean grow in size while the dry signal shifts to the western Pacific. During phases 4 and 5, the storms shift eastward to the Maritime Continent and the dry signal shrinks over the western-central Pacific and then re-emerges in the Indian Ocean. When the large rainfall patterns appear over the western Pacific the MJO enters phases 6 and 7. By phase 8, it has moved past the Pacific and dissipates. Because the dry and wet parts of the MJO are always following one another in a circle, phases 1 through 4 mirror phases 5 to 8, but with the cloudiness and dryness flipped.
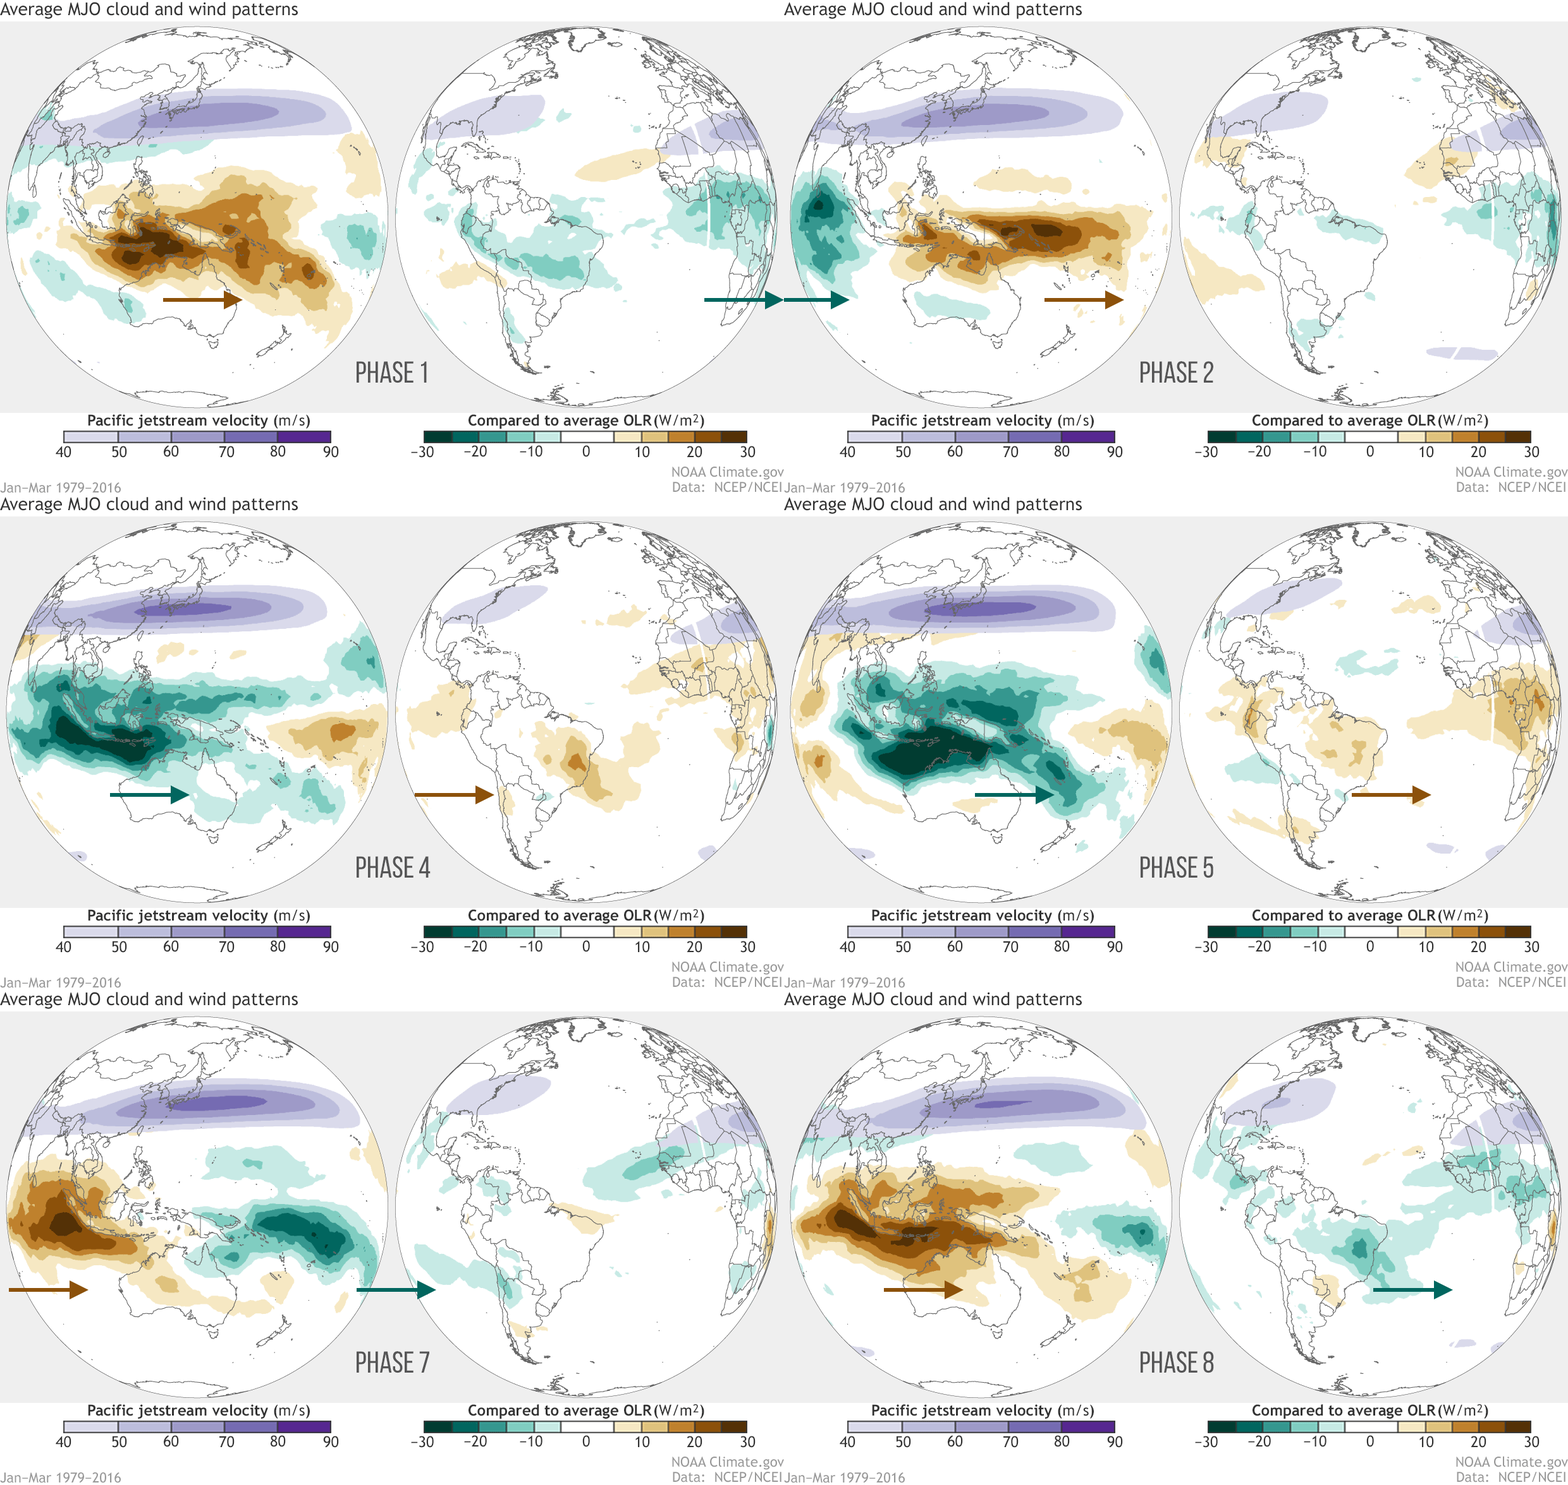
The ripple effect Zhou describes starts with changes in atmospheric circulation caused by the MJO moving slowly east and disturbing the atmosphere, which in turn causes waves up to 5,000 miles long to travel away from the tropics to the mid latitudes. For California, observations show that when a strong MJO is over the Indo-Pacific Maritime Continent, in phases 4 and 5, its storms feed bands of wind in the atmosphere called the Pacific jet stream, which can make atmospheric rivers stronger and more frequent along the West Coast. These rivers in the sky can provide up to 50 percent of California’s annual precipitation through the boreal winter. Because they are so essential to California’s landscape, scientists like Zhou are working on better understanding the relationship between the MJO and atmospheric rivers. They have also shown that when the enhanced center of the MJO is over the Indian Ocean, as in phases 1 and 2, fewer AR events emerge over the Northern Pacific, but when the enhanced center is over the western Pacific, the opposite happens.
The MJO seems to affect temperature, too. In 2019, researchers from UC Davis, and the Asia-Pacific Economic Cooperation Climate Center in Busan, South Korea looked at how the MJO affected heat waves across California’s Central Valley. They analyzed heat wave data from 1979 to 2010 and identified 24 heat waves. They then compared these instances to the phases of the Madden-Julian Oscillation and found that hot weather in the valley was “most common after more intense MJO activity in the eastern Pacific Ocean, and next most common after strong MJO activity in the Indian Ocean.”
Weather phenomena can amplify or nullify each other, and never occur alone. For example the El Niño Southern Oscillation (ENSO), which is a climate pattern across the tropical Pacific that switches between warm (El Niño) and cool (La Niña) phases, remains a stationary force in the background as the MJO passes through. “The MJO impact on the West coast of the United States can be different in La Niña or El Niño,” says Chidong Zhang, who leads the Ocean Climate Research Division of NOAA’s Pacific Marine Environmental Laboratory. “During a La Niña event, the central and eastern equatorial ocean surface temperature is much lower than normal, and the MJO is confined to the west; it does not propagate to the east. The opposite happens during El Niño years—the MJO propagates far more east.”
Because the waves from the MJO and ENSO can interfere with each other in positive or negative ways, their interaction is key. When either rainy or dry conditions occur in the same place at the same time, it causes a larger than average wetter or drier period. When the signals are opposed they can completely or partially cancel each other. If they cancel one another, a region will have the same surface temperature and rainfall as it has had on average for that time of the year.
One 2020 study by Wenyu Zhou and colleagues, published in Nature Climate Change, shows global warming makes it more likely that the waves propagated by the MJO to the Pacific Northwest region extend to the east during winter. This extended connection enables the MJO to have a bigger impact along the West Coast of North America. It also suggests that because the MJO cycles multiple times within a single winter, the larger its influence grows, the more it might increase volatility in California rain and snow patterns.
But at a point when the news is inundated with stories of the Western United States experiencing its worst megadrought in 1,200 years, any kind of rain, precipitous or not, would be welcome. When pressed to answer what kind of jigsaw pieces could fit together to actually make it rain, Yang Zhou takes a long time to answer. “One of my hypotheses is that during El Niño, you will have a pattern that is more favorable for a phase 7 MJO to excite more ARs,” she says. “First you need to have a background large scale circulation that is more favorable for moisture to be transported to California, and then the MJO in the right place to excite and transport ARs.”
Zhang agrees. “Statistically, if the MJO was in the state where it brought more rainfall as opposed to suppressing it, and it was in phase 6 or 7 then it would be more likely that it was going to bring more rain or snow to the West Coast.”
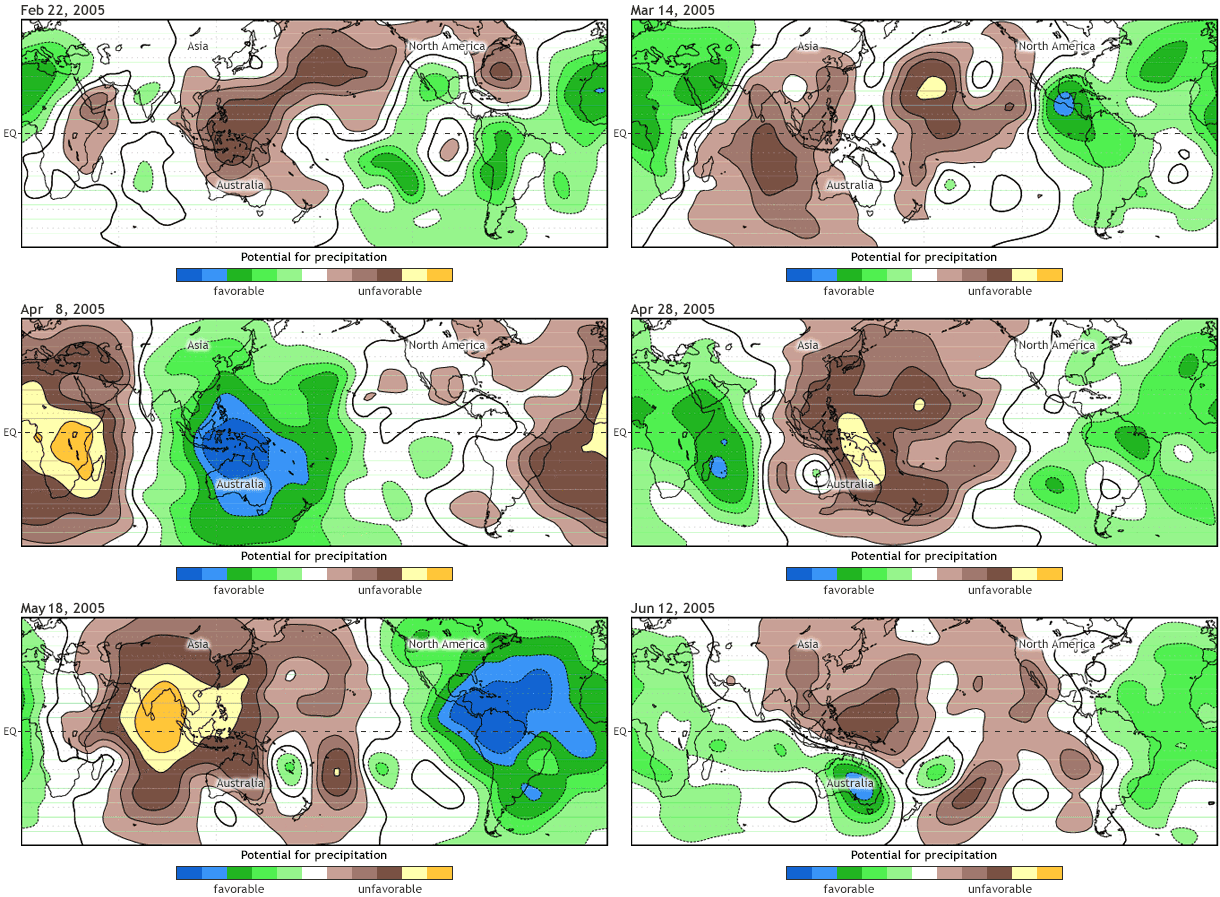
Meteorologists Roland Madden and Paul Julian identified and named the MJO in the 1970s after observing oscillations in wind patterns near Singapore. Since then, further research has shown it to be the dominant influence on week-to-week variation in the tropical atmosphere. The short timespan of the MJO also separates it from other events like ENSO that take longer to develop and longer to dissipate. NOAA’s Climate Prediction Center now prepares an MJO update every Tuesday that shows the MJO’s evolution, current status and predictions.
“It is a sub-seasonal source of predictability, which makes it pretty important,” Zhou says. “That’s why there are a lot of studies looking into the MJO.”
With advances in weather prediction, forecasters are able to predict MJO wind 30 days in advance but MJO rainfall for only up to ten days. The NOAA Climate Prediction Center advisory is based on just one climate model that is able to simulate the MJO. And even that one can do so only about two weeks out. “There’s no perfect model, each model has some error, and as you start predicting, the error grows and grows,” Zhou says, showcasing another example of the butterfly effect.
Models are stymied, in part, because the why of the MJO is still a mystery. After almost 50 years, researchers are still trying to provide an explanation for the oscillation, going as far as referring to it as the “holy grail” of tropical atmospheric studies. “If you were to ask me how the MJO forms, I would say we know, with a large margin of uncertainty,” Zhang says. “There are at least four different approaches to explain the MJO and the research community is still debating what the essential mechanism for the MJO is.”
Even the few models that can produce the MJO can have very different outcomes. “This tells you that the models are not adequate in reproducing the MJO yet, and that there are problems there that need to be fixed,” Zhang says. “So if you simulate anything different in the future climate, you cannot be certain how much of that difference is caused by global warming in the model, and how much of it is caused by the amplification of the unsolved problems of the model. We just don’t know.”


