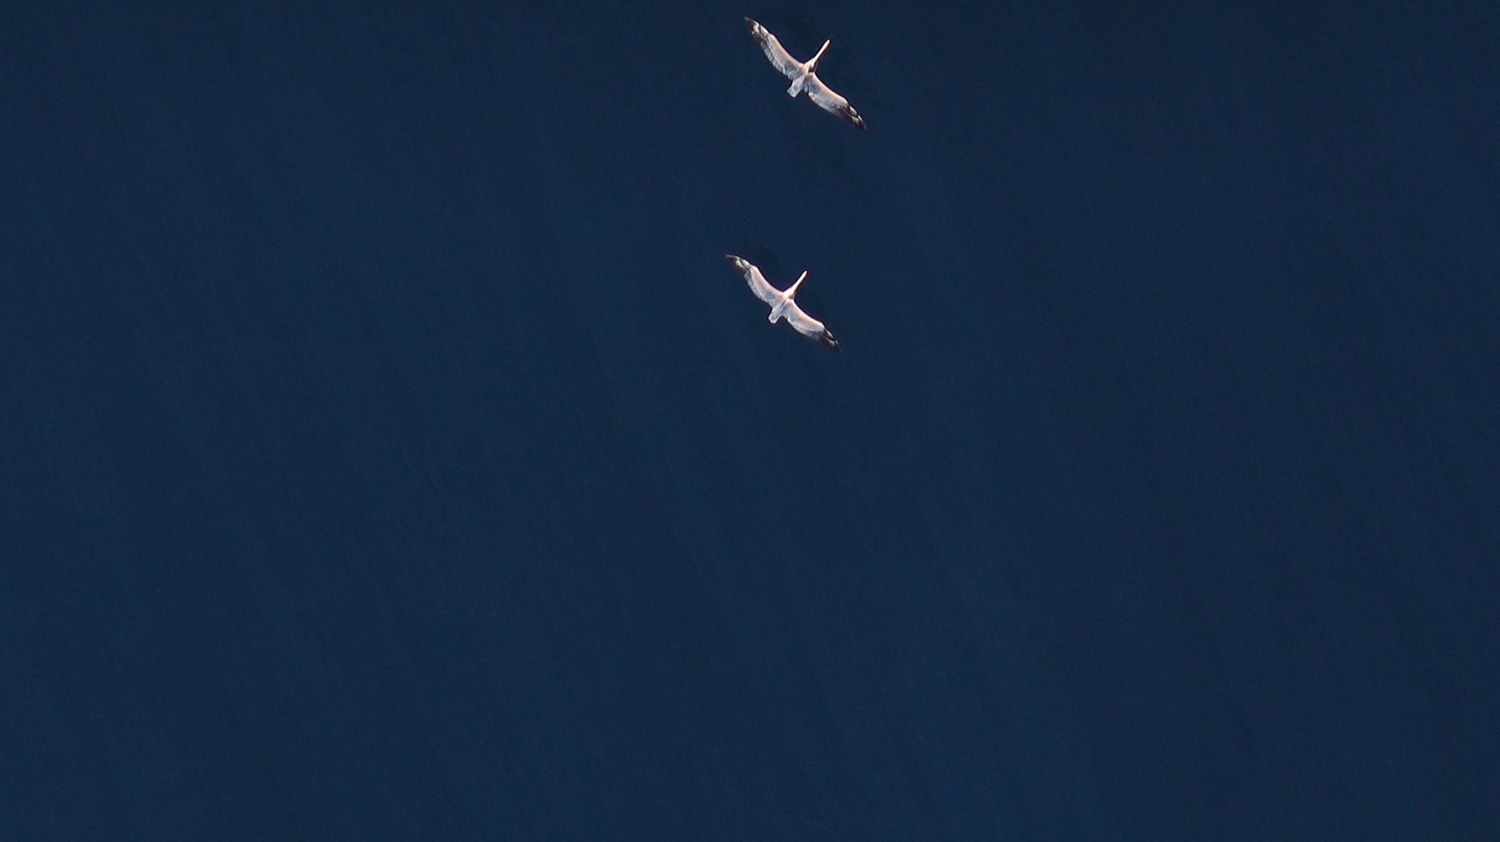
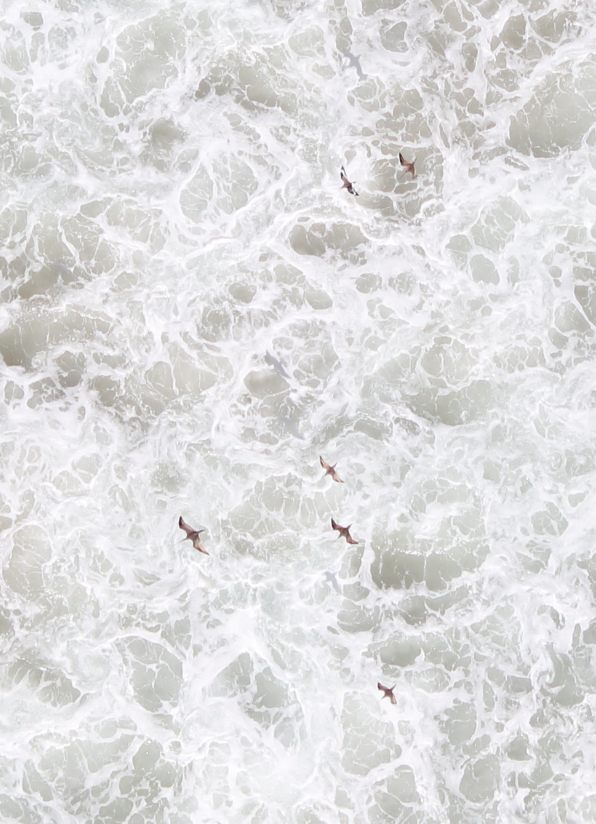
This is the way researchers have long surveyed seabirds: One or two birds, or six hundred of them, float by, powder-gray on slate-gray water. A few others flit along above them. An observer on a ship or in an airplane, specially trained to gauge distances, count flocks, and identify birds—all in a few seconds—dictates these sights into a tape recorder. Their voice is the data. What really happened at sea stays at sea.
In the past fifteen years, researchers have begun taking pictures, instead. An aerial photograph is more verifiable, and it’s archivable. But it turns out it’s not so easy to get a sharp picture of a moving bird from a moving airplane, not so easy to find the birds, and not so easy to do it all in the famously windy weather off California’s coast. The birds are not going to just be still for a sec, and neither is anything else.
Lately, U.S. Geological Survey researchers have been developing new methods to count the ocean’s birds from the sky, prompted by the coming West Coast offshore wind energy boom in said famously windy area. Governor Gavin Newsom wants to get 20 gigawatts’ worth built by 2045. Turbines and their construction have the potential to harm seabirds and marine mammals, and to understand and mitigate that impact, researchers collect baseline data beforehand. The U.S. Bureau of Ocean Energy Management does surveys every twenty years to inform its oil industry management. In 2018, anticipating the coming wind boom, BOEM hired a team led by seabird biologist Josh Adams, of the USGS’s Western Ecological Research Center, to conduct aerial surveys of seabirds and marine mammals over an area offshore. It included the zones being eyed for potential wind development, offshore from central California’s Morro Bay, some 230 miles south of San Francisco. (Another area lies north of the Bay Area, west of Arcata.)
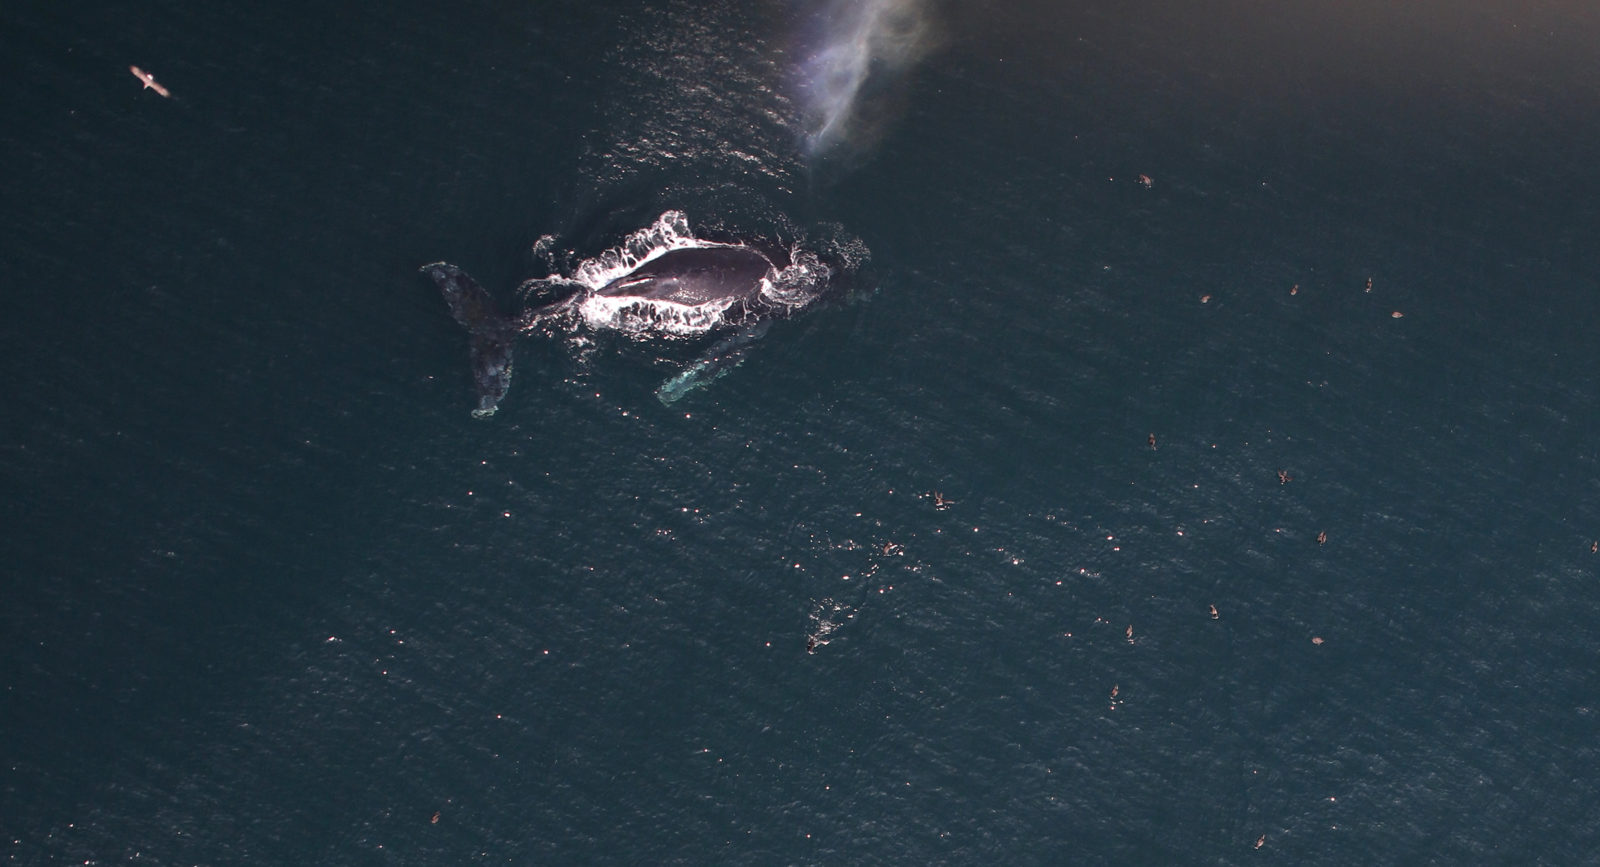
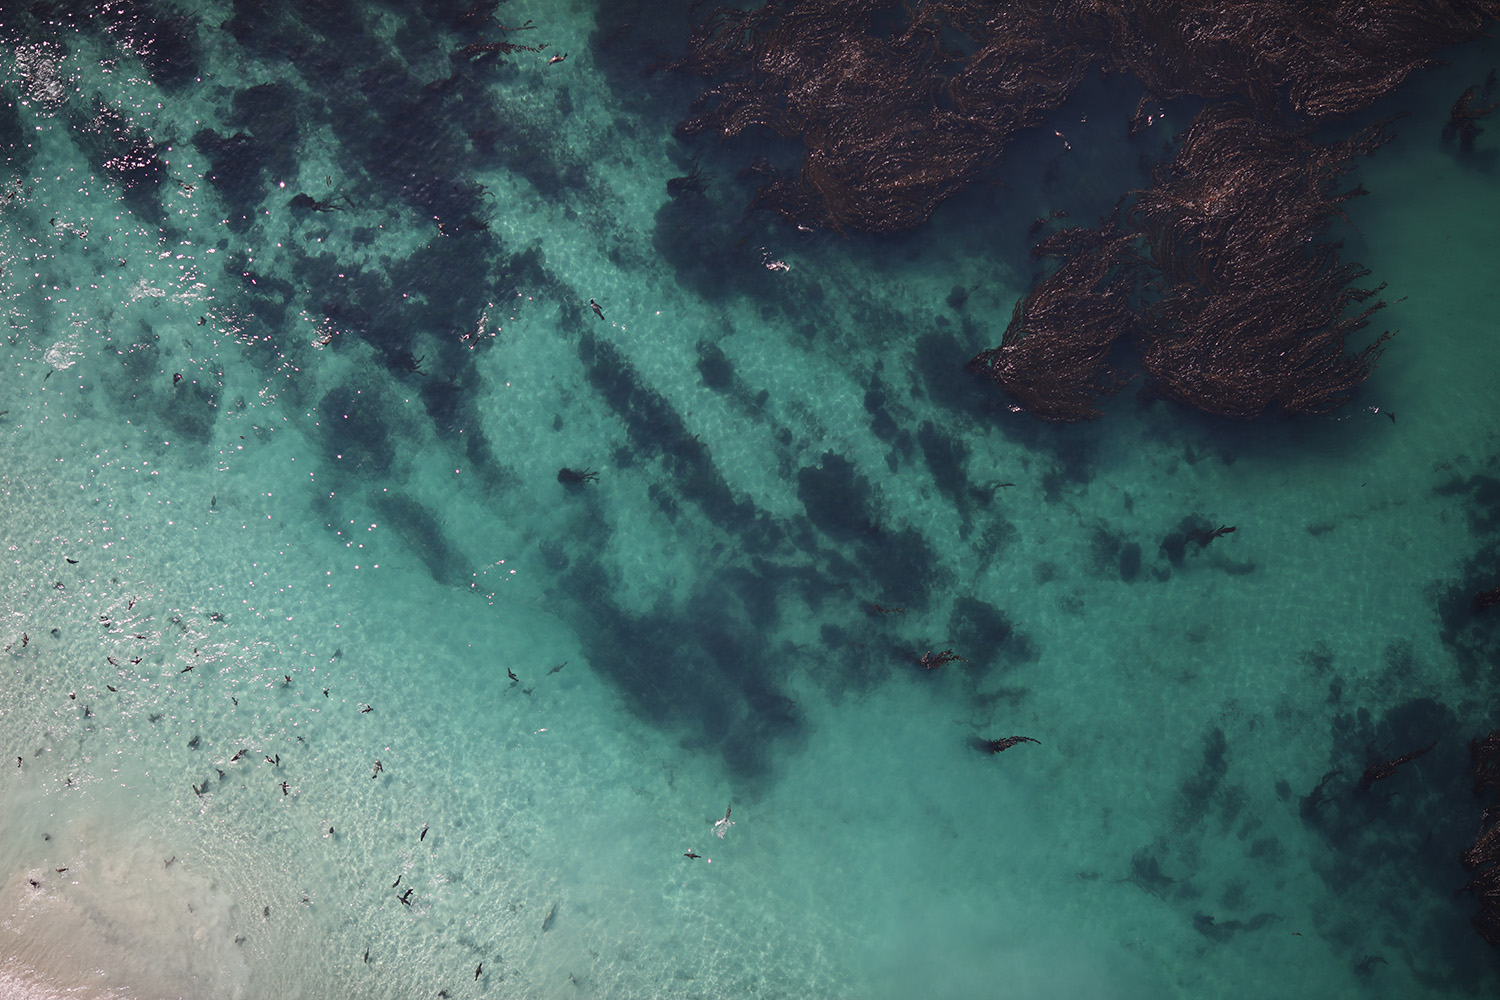
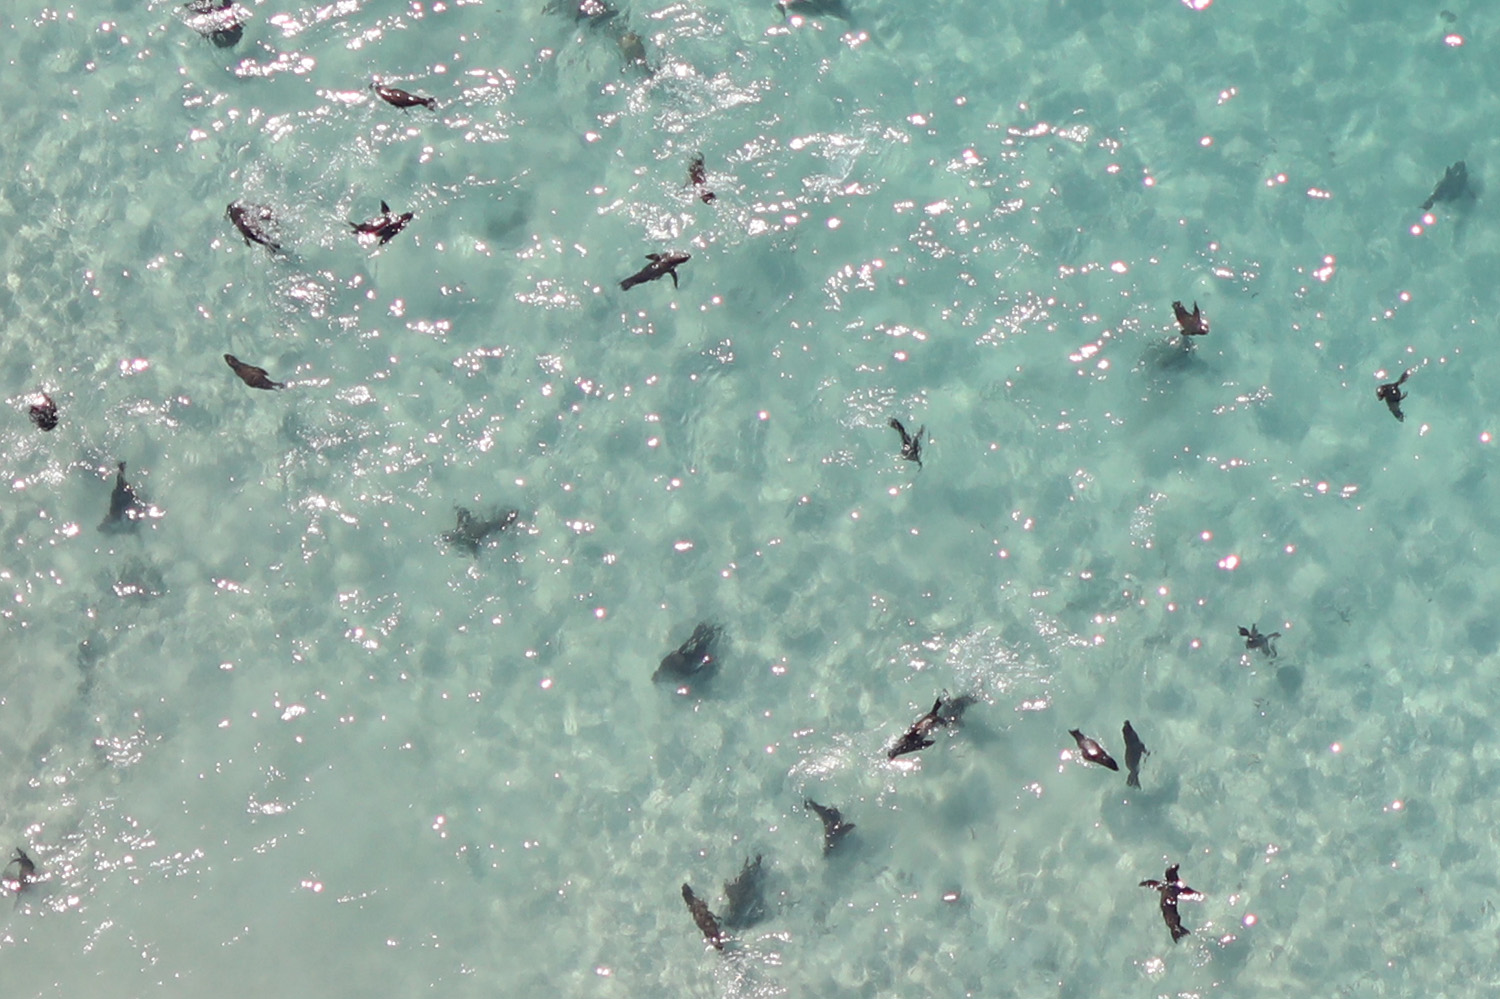
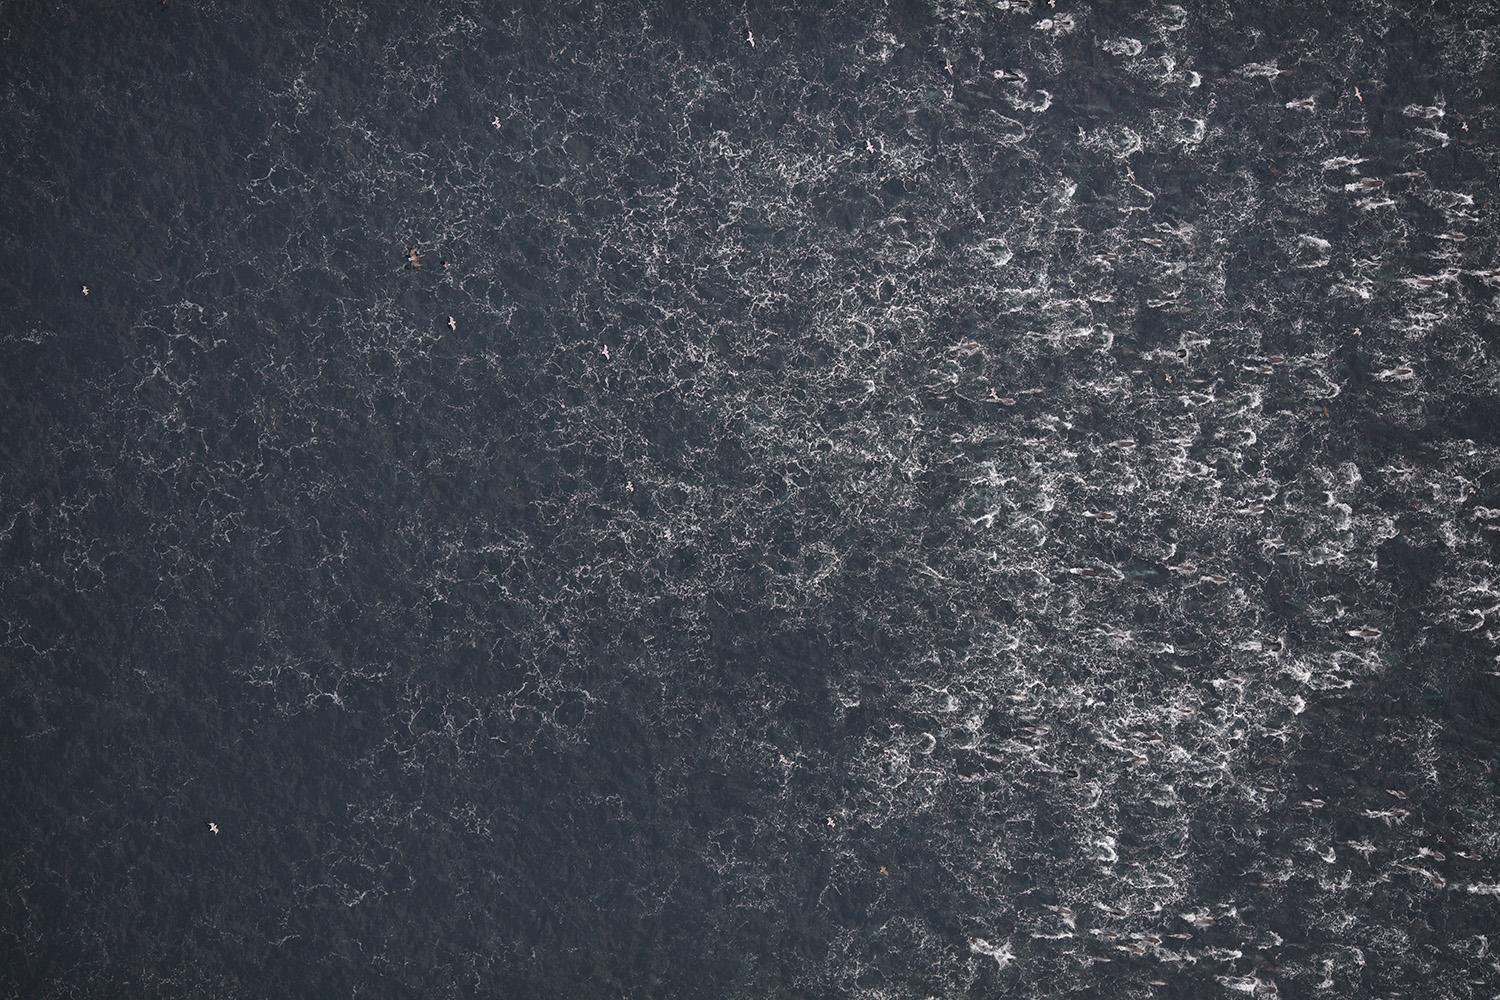
These surveys, conducted from 2018 to 2021, have produced images of extraordinary detail from above: A rare Couvier’s beaked whale. Sea otters floating in swirls of kelp. Sharks visible from underwater. A dozen Risso’s dolphins, white on a dark-emerald sea. A humpback breathing out, surrounded by shearwaters. They are strikingly beautiful, for government data. They were also hard-won.
A pandemic-era photo expedition
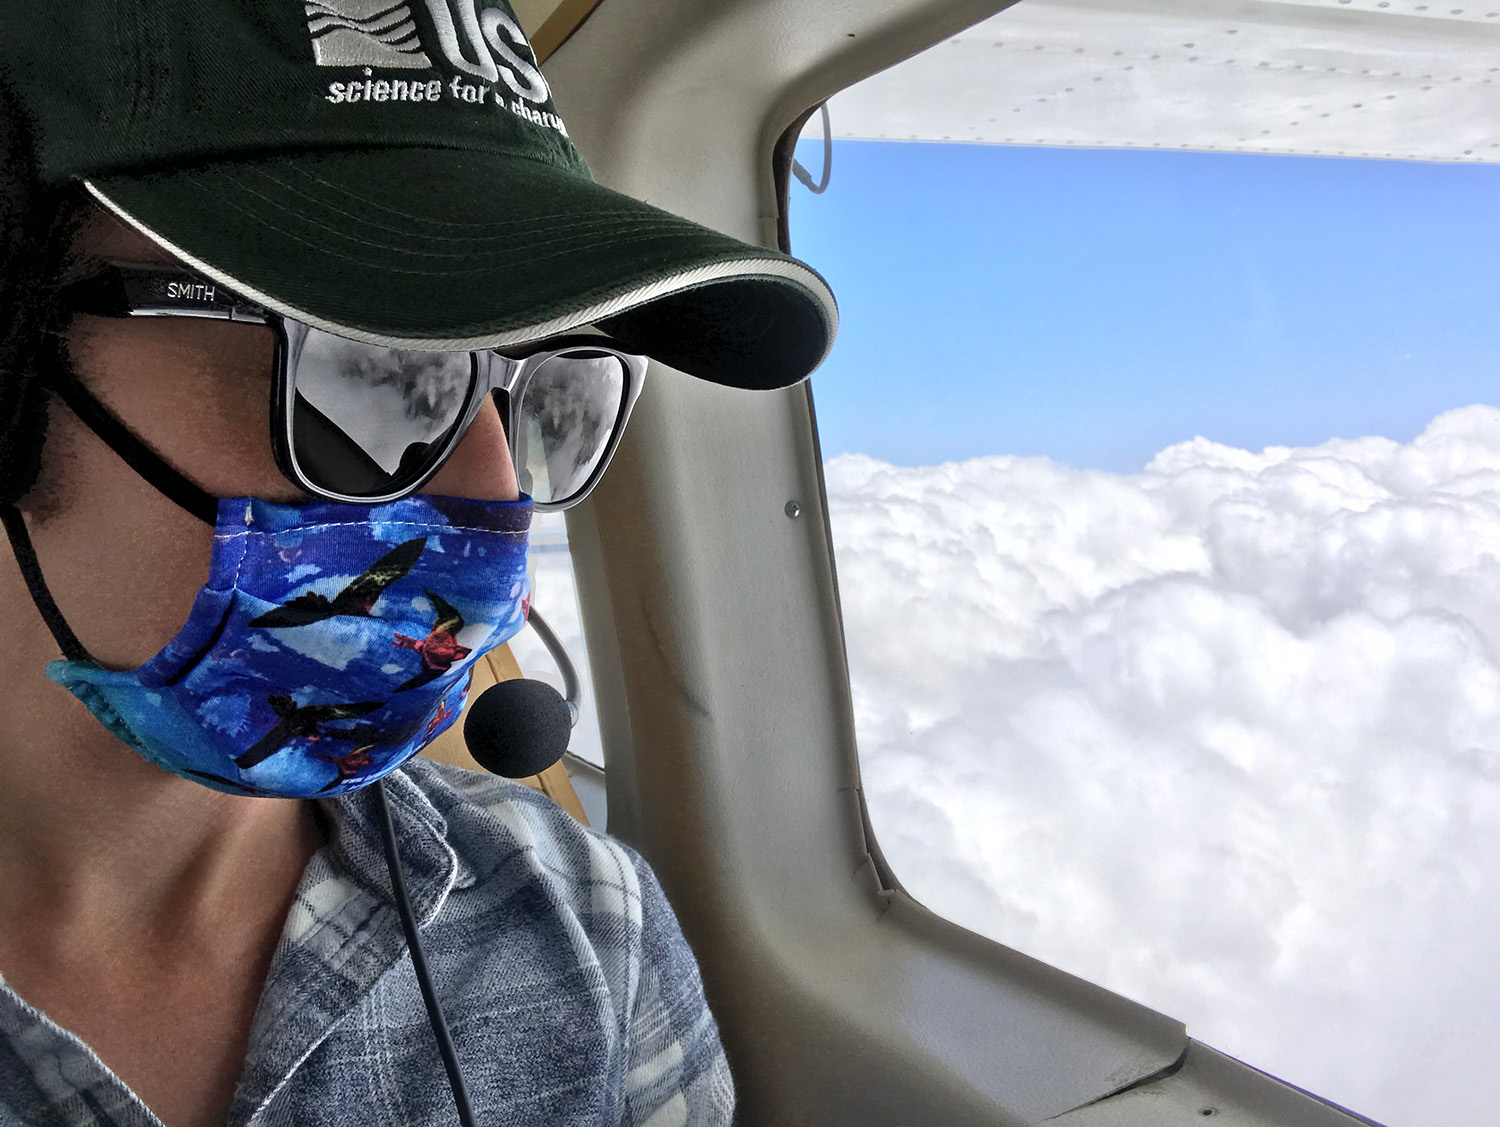
USGS biologist Laney White spent much of those four years hanging out at a hangar six hours from her home in Santa Cruz, obsessively refreshing her weather apps. She couldn’t have rain or more than 15 knots of wind or low cloud cover. Nobody could get Covid. White got to know all the mechanics. The goal was to fly a grid of straight lines over more than 27,800 square miles of ocean, covering every season, from the coast off Big Sur south to the U.S.-Mexico border.
It takes some trick flying to photograph seabirds from the air without smearing pixels, and that trick is to fly very slowly. The plane, a Partenavia, is a special dual-prop, fixed-wing Italian model that does that well. You also need a crack pilot who is comfortable flying close to stalling speed. There is a hole in the belly of the plane, right next to where White sits, where three off-the-shelf DSLR cameras (with 135mm or 100mm lenses) point toward the earth at different angles, taking a photo every three seconds. They can pick up creatures far smaller than White can see: storm-petrels, for example. White has a monitor to check what the cameras are seeing, and she’s fixing systems on the fly. She’s not an engineer, but she is a field biologist. Josh Adams, the USGS seabird biologist who is the principal investigator, says, “We come from a background of having to really figure things out at every level—starting with how to stay dry.”
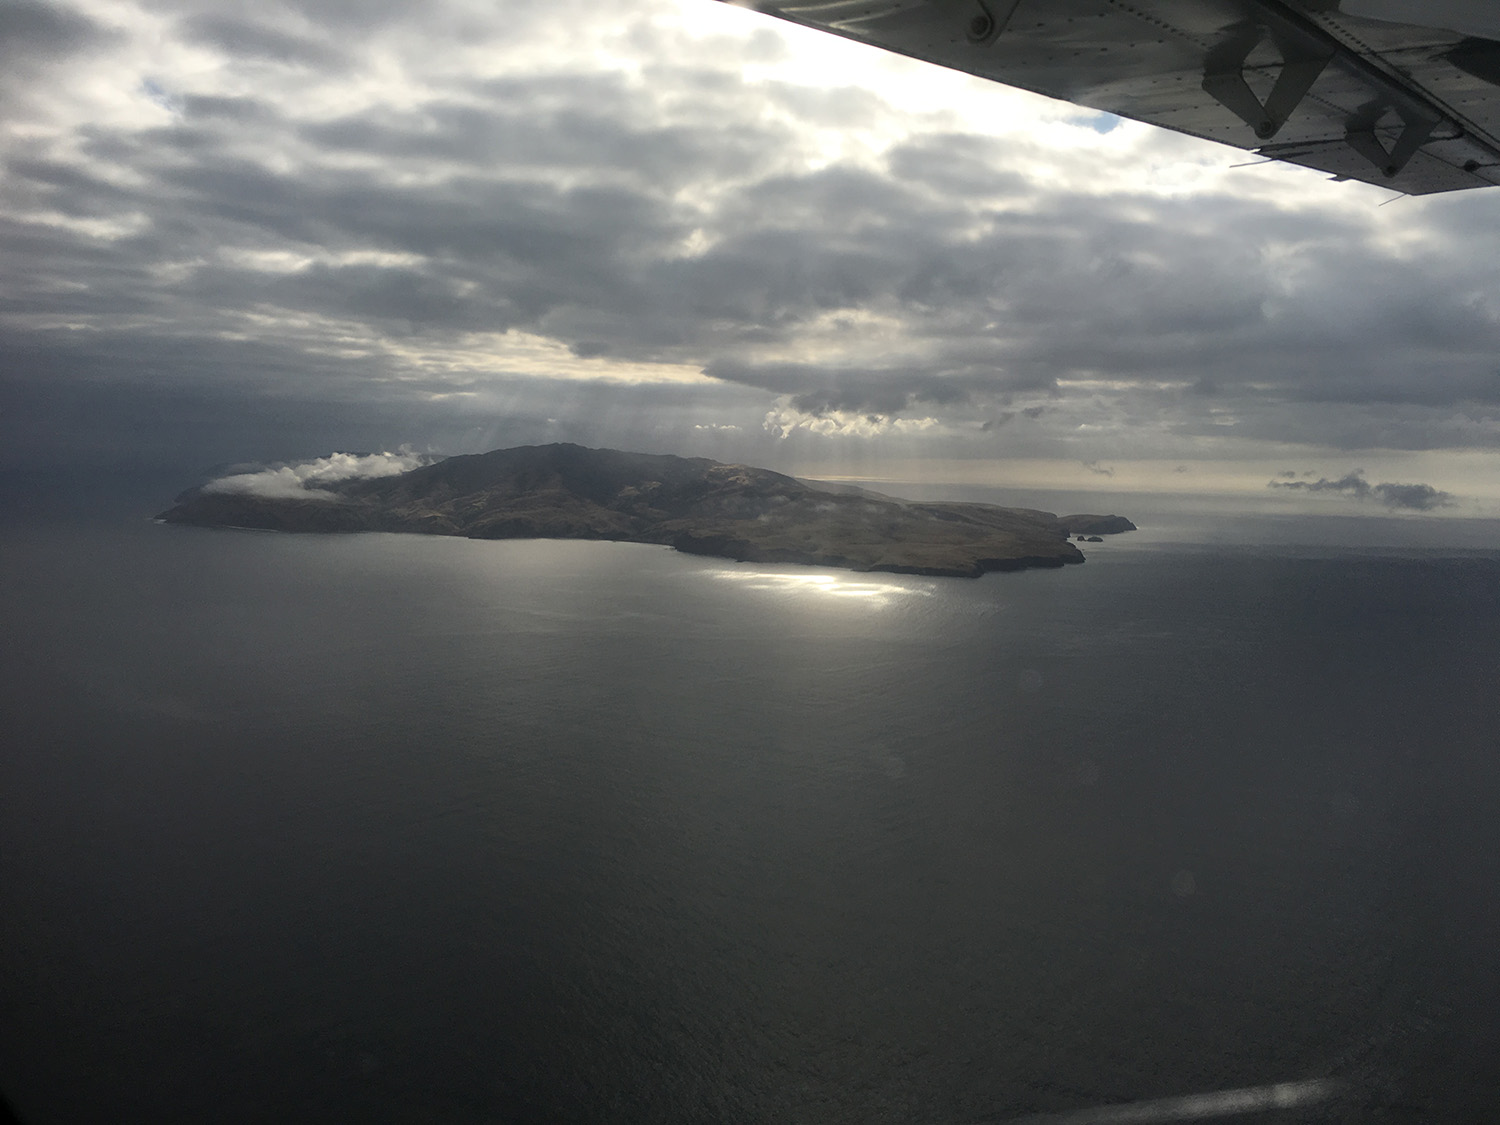
The pilot flies at 1,000 feet, offering a new perspective. Typically aerial surveys have been flown at very low altitudes, like 200 feet, so observers can see what’s below, much like the old shipboard surveys. But that doesn’t leave pilots much time to react in a crisis, Adams says. Flying slowly is “a nice trick at 1,000 feet, and it’s a white-knuckle trick at 200 feet,” he says. People have died, like in the 2003 crash off Florida’s coast that killed four people on a right whale survey. An Idaho government site describes low-altitude surveys as “the most dangerous work-related activity for wildlife biologists.” Achieving some altitude was particularly important for this project, because once there are wind turbine blades sweeping some 500 feet into the air, survey planes will have to fly above them. To get comparable before-and-after data, researchers have to fly high from the start.
Early on, White spent a lot of her aerial time not looking down but troubleshooting. Later she had more time to take in the Pacific ocean and its residents. A superpod of dolphins, thousands of them; twenty gray whales on their annual migration. “There are some magical days like that,” she says. “And then some days where computers are crashing and equipment is going offline.” Days when the winds come up unexpectedly, or wildfire smoke casts a sepia tone over all the photos.

And you thought your photo library was daunting to organize
White is unsure how much time she spent in the air, but she produced 800,000 photos. Most of them are empty—just vast swaths of the timeless Pacific. Finding the gems is the task, but a human could not reasonably sift through it all. This is where teammate Cheryl Horton, a field biologist by training, comes in. She dives into the world of artificial intelligence, finding communities within USGS that can help. The language is all new, with a program called Slurm (presumably after the mind-altering soft drink of the animated TV show Futurama), supercomputers called Tallgrass, Denali and Yeti, a massive backup called the Black Pearl Converge Storage Device. Horton takes all this in stride.
An AI system is like a puppy that left to its own devices will just find cat poop, so you have to train it to find the things you care about, like storm-petrels or beaked whales. You give it a training data set, a subset of the big one, which ideally captures the range of variation it will encounter in the whole enchilada. A gull can look very different at 8 a.m. versus midday when the sun’s overhead, different the next day when the wind is whipping up whitecaps, and different still in summer versus winter. Add to that the eternal divide between human and machine. “Trying to find the things that we as humans are concerned about, and being able to quantify those in a way that corresponds to what the computer is looking at, is actually quite difficult,” Horton says. Solving these problems still requires humans to pore through boatloads of photos manually. “I think a lot of people think you just pop some images in and your answer pops out on the other end of these models,” Horton says. “That’s really not quite how it works just yet.”
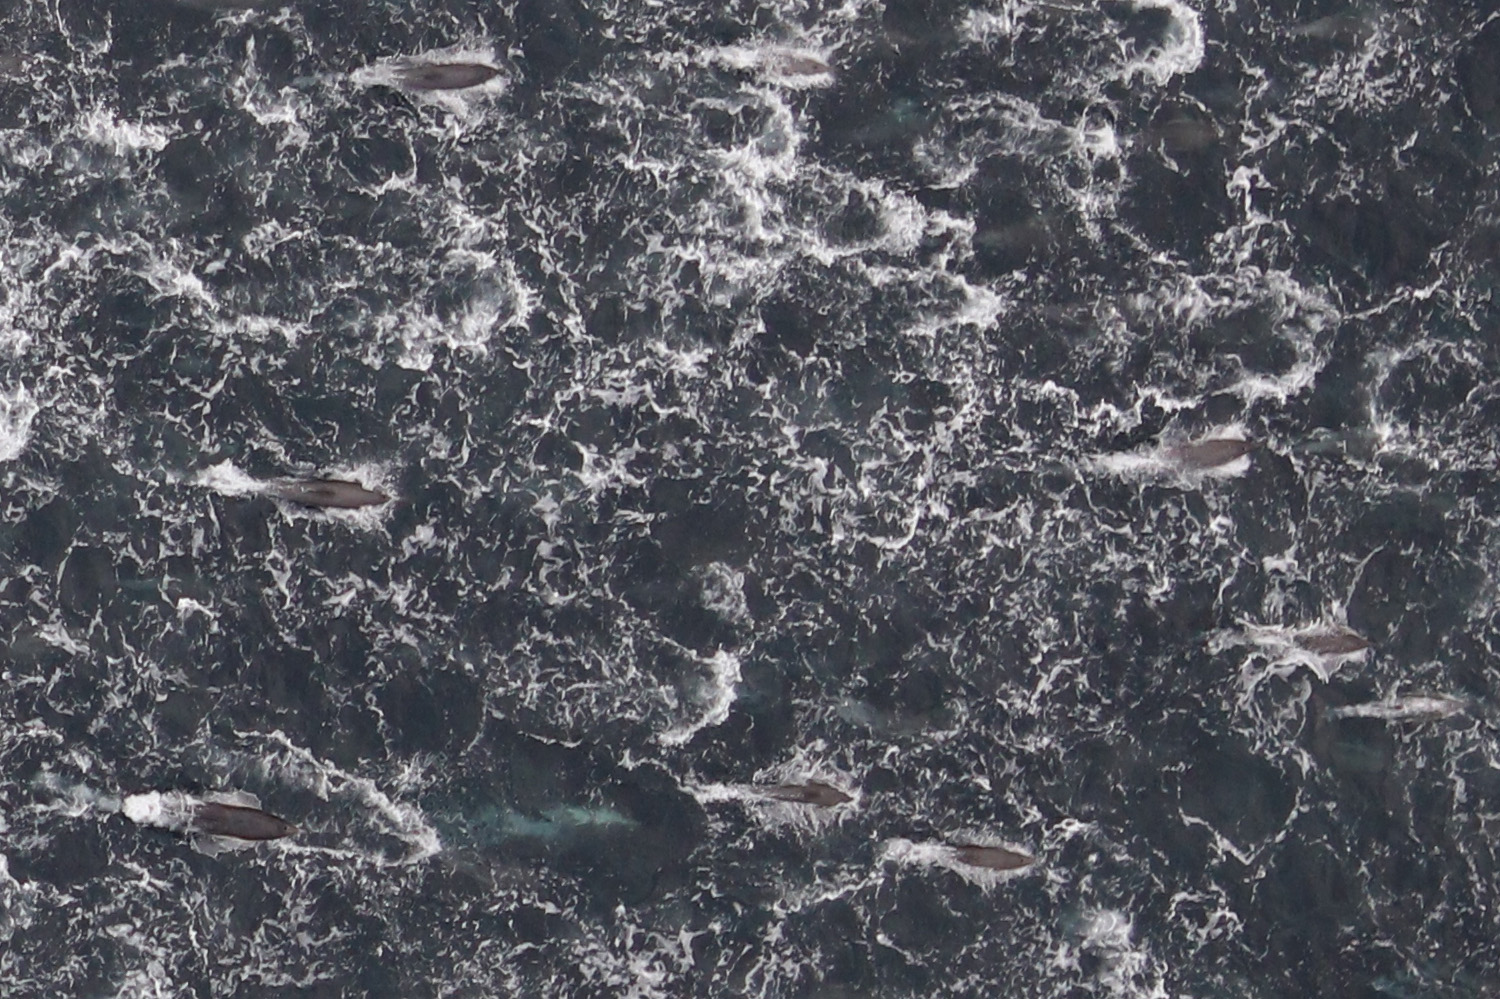
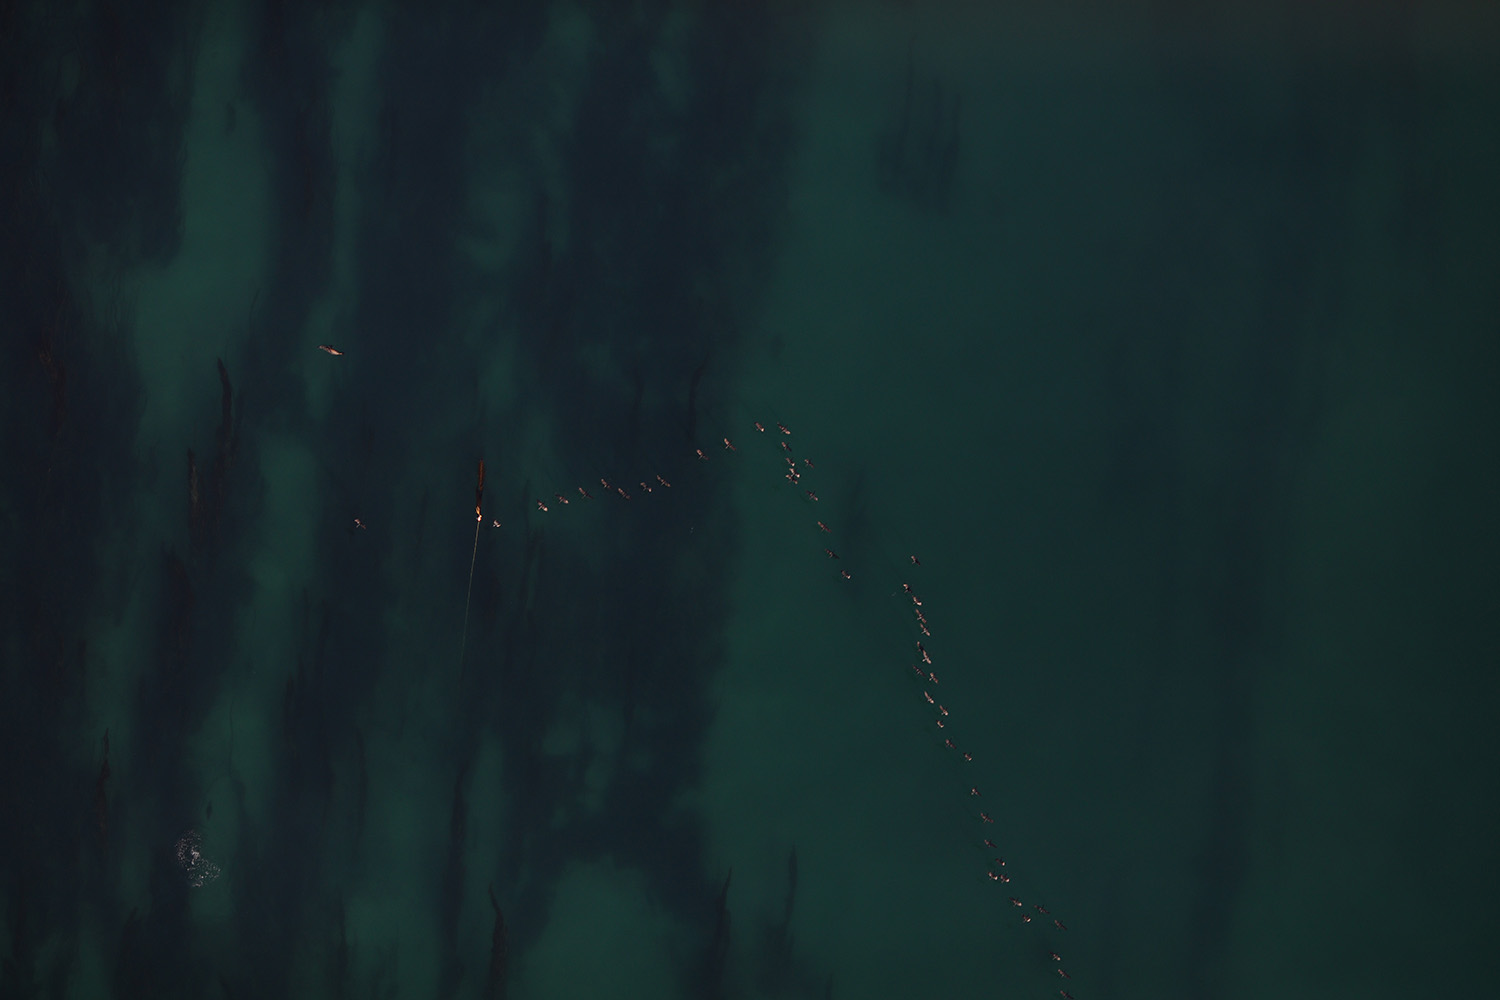
Even before the AI can begin, Horton and team must prepare the data for it; she worked with tech-savvy wildlife biologists at a small Santa Cruz-based company, Conservation Metrics Inc. They begin by slicing each huge photo into 90 squares, so that each one now has a manageable amount of information in it. (Which means at that point, they really have millions of photos in the library.) Only then can they ask the AI to predict which images have stuff in them—and after that, ask what that stuff may be. About one-quarter of the images have stuff, the model has predicted. The team has experimented with lots of different categories—kelp, buoys, trash, surfers, grebes, jellyfish, and shearwaters are among the more specific ones. But so far the AI has done the best with seven more general classes of Thing: bird, dark bird, dark bird flying, light bird, marine mammal, other, and null, which is empty ocean.
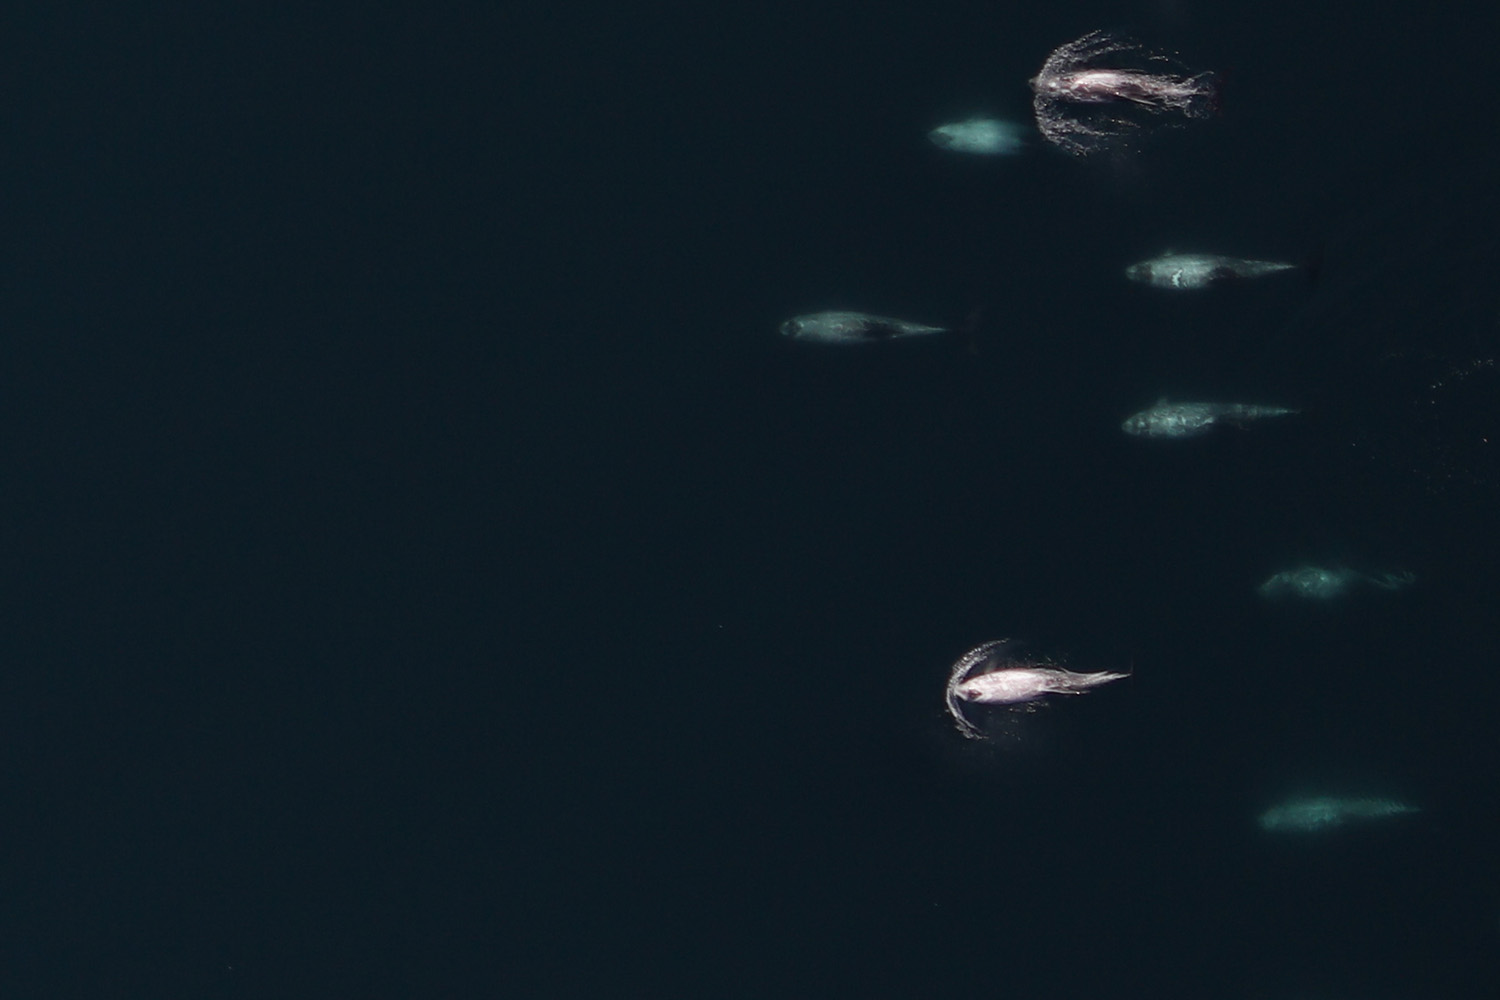
The AI “is not at the stage yet where we can say, this is a Western gull, this is a shearwater,” Horton says. But these group categories already are “really useful,” on par with what visual observers could get in past surveys. They also allow people to identify the species in photos more efficiently. And as the researchers improve their model and methods, finer detail, lower-taxa identifications, will begin to emerge. That’s something those shipboard surveys could never do. (Eventually, Adams said, people may be able to mathematically sharpen photos beyond the cameras’ original resolution, Blade Runner-style.) Now, researchers can use the data to assess how many birds are in each area and at what times of year, and compare the answers to surveys conducted over the past forty years. Other researchers will also be able to use these government-produced photos and training data. For instance, another USGS team is now retraining the AI on otter-specific data to get it really good at finding just otters, so they can answer otter questions.
The paths flown by short-tailed albatrosses won’t determine, on their own, which square of ocean gets a wind turbine, Adams said. That’s true for big resource-extraction projects more generally, not just wind. Siting is a complicated affair that overwhelmingly depends on many other factors, like where the wind is good and how transmission lines will get there. What the surveys will do is tell resource managers areas where they might need to pay attention to sea life impacts, Adams said. Then they can begin to investigate how to reduce those impacts. “Maybe we turn the propellers off from nine to eleven at night, because we know that that’s when the fancy albatross flies through the zone—we can avoid strike issues by modifying the behavior of the resource extraction,” Adams says. “Or maybe, if you just move the sand mine twenty steps over to the corner of the polygon, you’ll avoid some crazy reef that’s there that’s really important for the sand crab.” Without such surveys, you’d never even know the crab was there in the first place.
